 Co nowego?

The New Reality of the Canadian Market
Canadian grocers are operating in one of the most challenging pricing environments in recent memory. Food inflation has consistently outpaced overall CPI: by March 2026, food-from-stores was rising at +4.4% annually versus +2.4% for all goods. Since 2022, grocery prices have climbed approximately 22% in total, compared to just 13% for other consumer items.
The shopper response has been swift and structural. According to multiple industry surveys, 83–97% of Canadians report that grocery costs continue to rise, and the vast majority have changed how they shop.
The new Canadian grocery shopper is:
• A discount-format loyalist: roughly 87% of Canadians now shop regularly at low-price or discount grocers
• A private-label convert: 25–42% are purchasing more store-brand products than a year ago
• A deal chaser: 63% of shoppers decide which store to visit based on weekly promotions
• A cart splitter: many split their weekly list across two or more stores to maximize savings
For retail operators, this behavioral shift creates a dangerous trap: the instinct to respond with blanket discounts. While discounts may drive short-term foot traffic, they erode already thin grocery margins (typically 3–4%) and train shoppers to never pay full price.
The result is a race to the bottom that independent chains and regional operators cannot win against Loblaw, Walmart, or Costco. The answer is not to discount more aggressively. It is to discount more intelligently, and that requires understanding what is actually happening inside your customers’ baskets.
Basket analysis as a strategic tool against inflation
Basket analysis is the systematic study of which products are purchased together, how purchase patterns shift under pricing pressure, and which items are the true drivers of customer loyalty. In an inflationary environment, it becomes the core of a retailer’s competitive intelligence.
Some of the most valuable discoveries in basket analysis are the ones no merchandiser would have predicted.
- A pharmacy-adjacent grocery chain in Ontario finds that customers who buy antacids on a weekday evening almost always add a frozen pizza and a two-liter of cola — a stress-purchase cluster invisible to any category plan.
- A Quebec discount banner notices that bulk laundry detergent reliably co-travels with energy drinks and single-serve instant noodles — a basket fingerprint of young renters stretching a paycheck.
- In Western Canada, a regional chain discovers that premium dog food appears more consistently alongside organic baby vegetables than alongside other pet products — suggesting a specific household type that completely reframes how both categories should be shelved and promoted.
There are three critical applications for Canadian grocers right now.
1. Identifying product substitution before it becomes a problem
When prices rise, shoppers do not stop buying, they switch. They move from a national brand to a private label, from a premium cut of meat to a budget option, or from your store to a competitor’s. The question is whether you see that substitution in time to respond.
Basket analysis maps the "migration path" of price-sensitive shoppers. By analyzing SKU-level purchase sequences over time, a retailer can identify:
• Which national-brand products are losing basket frequency as prices rise
• Which private-label alternatives are being adopted as substitutes (and which are not)
• Whether substitution is happening within your store or whether those sales are leaving entirely
Consider a practical example: a mid-size Ontario chain notices that sales of a branded pasta sauce have declined 18% over two quarters. A surface-level report flags this as a product underperformer. Basket analysis tells a different story — customers who previously bought that sauce are now purchasing a competing store-brand version, but their overall basket size has remained stable.
Learn more about analyzing your chain's sales data.
2. Redesigning promotions around basket logic, not gut feeling
Most promotional decisions in Canadian retail are still driven by supplier co-funding calendars, historical habit, and gut instinct. The result: money is spent on discounts that generate zero incremental volume because the item would have sold anyway, or worse, discounts that cannibalize full-margin basket companions.
Basket analysis introduces a fundamentally different promotional logic based on two concepts:
Magnet Products
A magnet product is a high-purchase-frequency item, often a commodity like eggs, milk, or bread, that reliably brings customers into the store. When discounted, it increases foot traffic. But the real value is not in the discounted product itself; it is in what that customer puts in their basket alongside it.
By mapping the basket companions of a magnet product, a retailer can calculate the true profitability of a promotion. If a discount on whole chickens reliably drives same-basket purchases of pasta, fresh herbs, and cooking oil, all at full margin, the total promotional ROI is far stronger than the discount cost suggests.
Try to find your store's magnet products with a 14-day free trial of Datawiz
Bundle Architecture
Blanket discounts are blunt instruments. Bundles are surgical. Instead of reducing the price of an individual SKU by 20%, a bundle offer groups two or three complementary items at a combined discount, protecting unit margins while increasing total basket value.
This approach is especially powerful in inflationary periods when shoppers are already looking for “value signals.” A bundle of crackers + cheese + deli meat at a combined 15% discount feels like a meaningful saving to the shopper while generating higher total revenue per visit for the retailer.
Key steps to implement bundle-based promotions:
• Run association-rule analysis to identify product pairs and triples with high co-purchase rates
• Calculate the margin impact of bundling versus individual discounting
• Test bundle offers in two to three pilot stores before chain-wide rollout
• Measure incremental basket size, not just promoted-item sell-through
3. Assortment management and planogram optimization
Inflation-driven shopping behavior creates assortment challenges that go beyond pricing.
As shoppers consolidate trips and become more deliberate about what goes in the cart, two risks emerge:
• Overstocked SKUs that were purchased impulsively in better times now sit on shelves, tying up working capital
• Understocked SKUs in the value segment that shoppers now actively seek are generating out-of-stock (OOS) events and lost sales
Basket analysis provides the evidence base for assortment decisions that pure sales velocity data misses. A product with modest individual sales may be disproportionately present in high-value baskets or co-purchased with your top-margin items. Removing it could have a cascading negative effect on the baskets it anchors.
Conversely, products that appear in the data as "frequently purchased together" should be physically co-located in the planogram. This is not just merchandising instinct, it is data- validated shelf architecture. When a customer finds complementary items adjacent on the shelf, the average basket size increases and the shopping experience feels more intuitive.
Practical assortment actions for Canadian grocers:
• Rank SKUs not just by individual sales velocity, but by their basket contribution score (how often they appear alongside high-margin items)
• Identify SKU clusters by customer segment — what the price-sensitive shopper buys versus the convenience shopper
• Build planograms that reflect high-affinity product relationships, particularly in meal solution categories (sauces, proteins, grains)
• Set OOS alerts for high basket-affinity products, not just top-selling SKUs
Practical Steps for a Canadian Retailer
Basket analysis is only as valuable as the actions it enables. Here is how to move from data to decision in a Canadian grocery context.
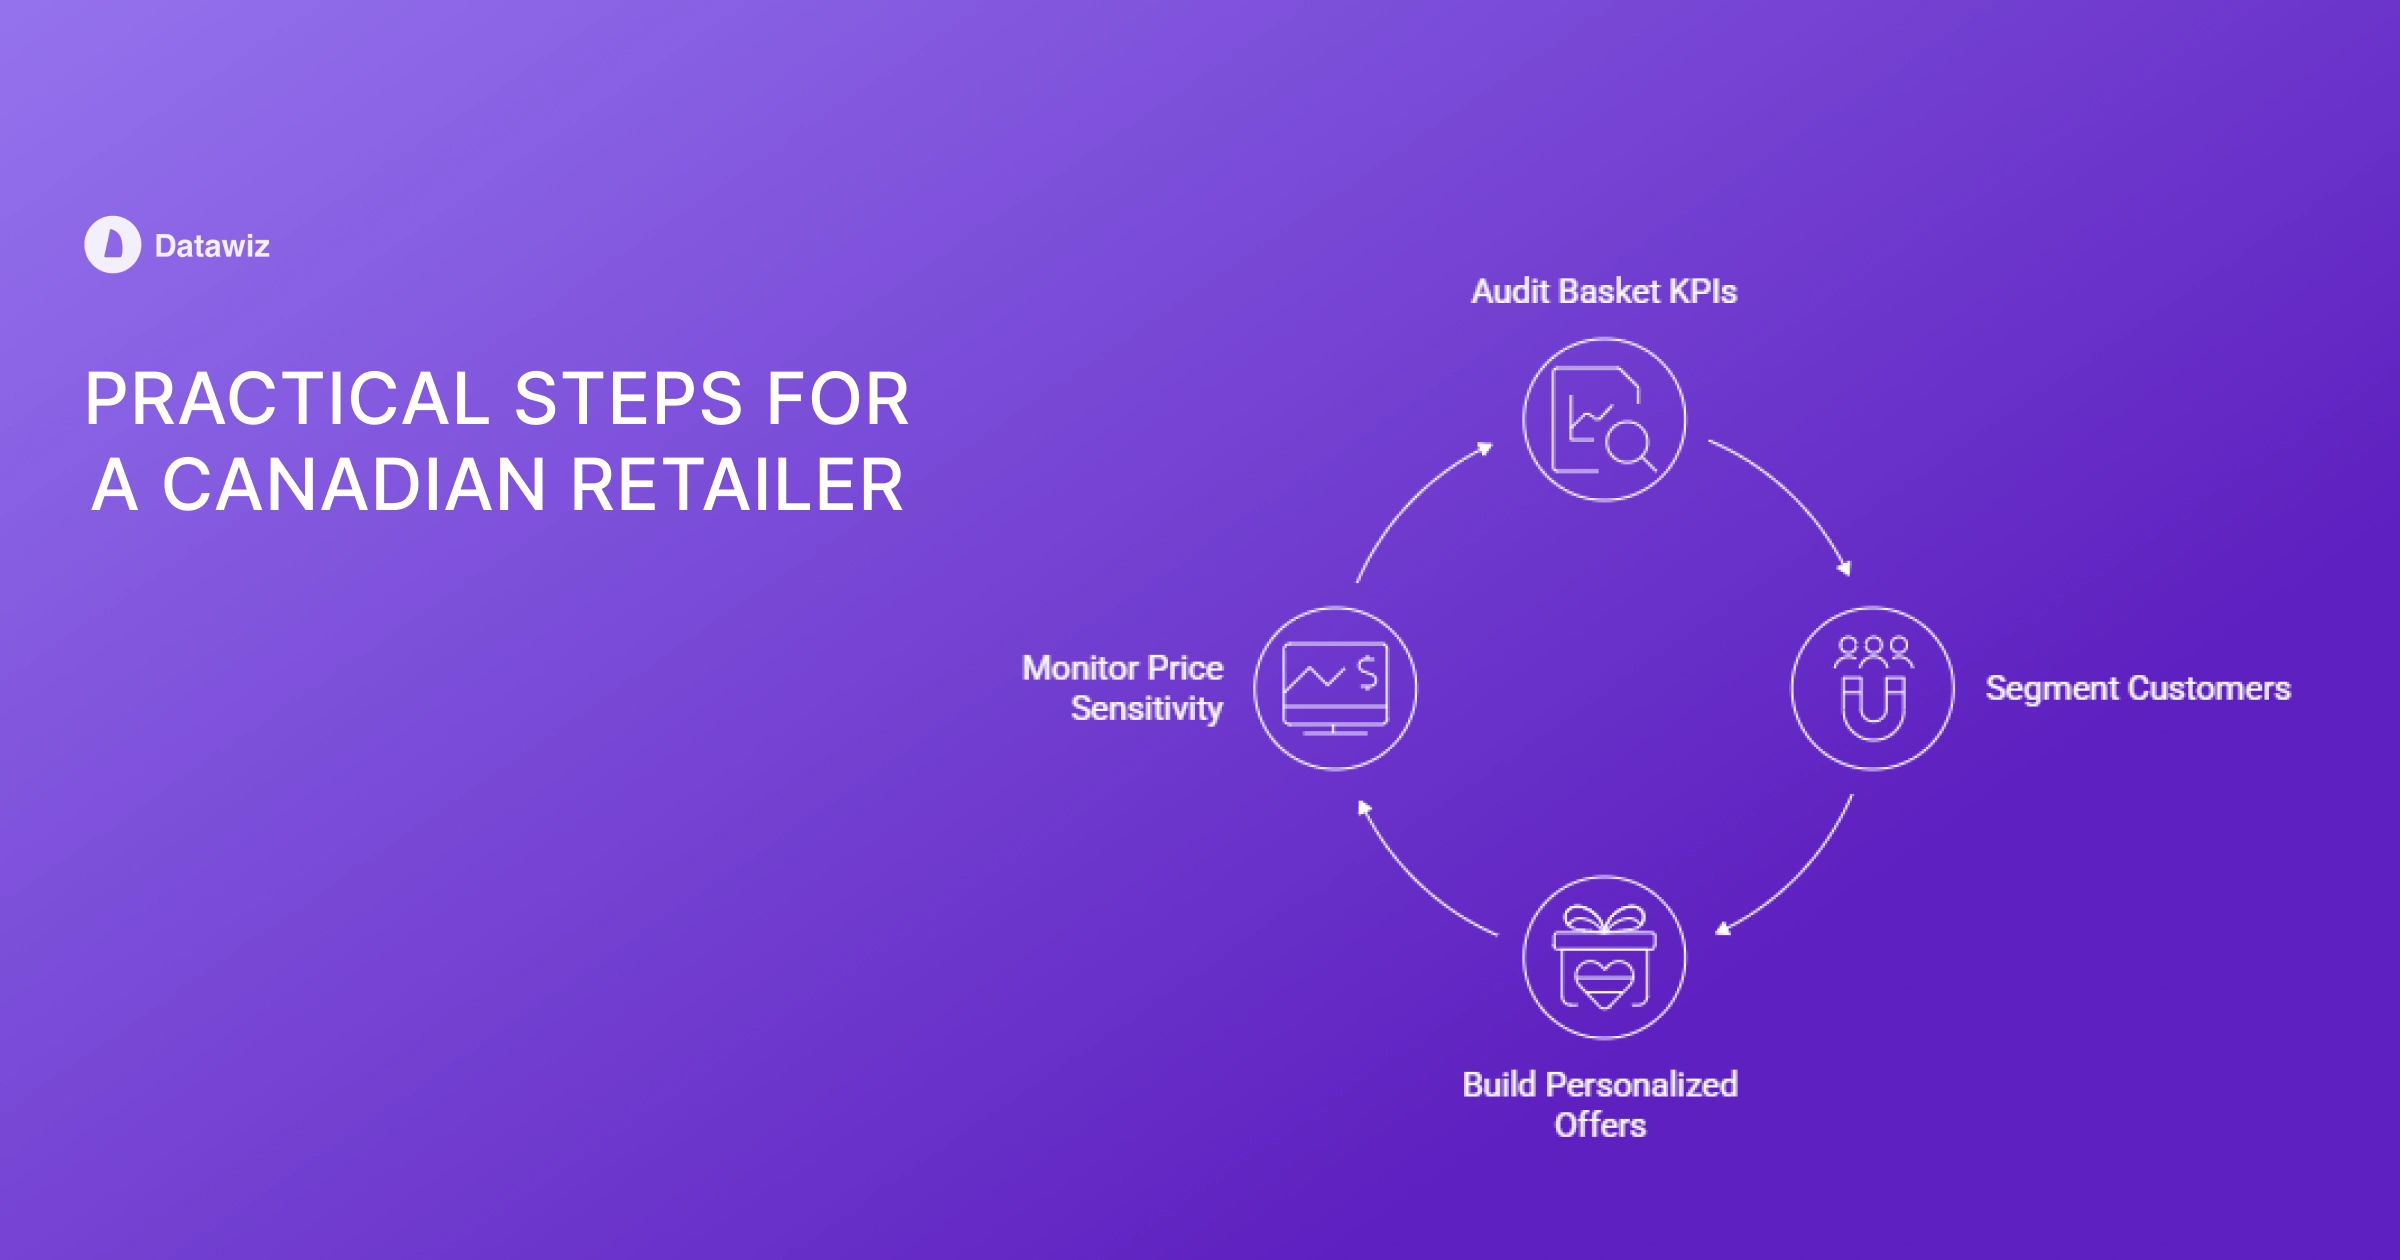
Step 1: Audit Your Basket KPIs
Before launching any analytical initiative, establish a clear baseline. The three metrics that matter most in an inflationary environment are:
• Average transaction value (ATV): Is it declining even as unit prices rise? This indicates customers are removing items from the cart rather than just switching brands.
• Items per basket: A declining items-per-basket is an early warning signal that shoppers are editing their purchases more aggressively.
• First-item-removed rate: Track which categories are most commonly abandoned when comparing full-store loyalty data across shopping occasions. These are your most price-elastic categories and the ones where bundles or private-label substitutes will have the highest impact.
Step 2: Segment Your Customer Base by Inflation Sensitivity
Not all shoppers are responding to inflation in the same way. A loyalty program data analysis will typically reveal at least three distinct groups:
• Stable full-basket shoppers: these customers have maintained their purchase patterns. They are loyal to your store and less price-sensitive. Do not over-discount for this segment, it reduces margin without changing behavior.
• Basket-editing switchers: these shoppers are still visiting your store but purchasing fewer items per trip. They need targeted bundle offers and private-label introductions to maintain basket value.
• Deal-driven visitors: these shoppers only appear during promotions. The goal is to convert at least a portion of them into more regular customers by identifying which magnet products bring them in and building loyalty pathways around those products.
Quebec shoppers, for example, show particularly high engagement with discount formats like Maxi. Ontario and Western Canada show different private-label adoption curves. Datawiz’s regional segmentation allows you to apply different assortments and promotional strategies by geography within the same chain.
Step 3: Build Personalized Offers Around Basket Patterns
Personalization does not require a multi-year CRM transformation project. It begins with a simple principle: give each customer a discount on something they were already going to buy, bundled with an item you want them to add.
Using basket analysis, a retailer can build rule-based personalized offers in practical timeframes:
• Identify the top 10–15 product categories by purchase frequency for each customer segment
• Create bundle offers that combine a discounted anchor (the magnet product for that segment) with a full-margin companion
• Deliver the offer through the loyalty app, weekly email, or printed receipt coupon
• Measure redemption rate and incremental basket value, not just coupon clip rate
This approach is already being used by Canada’s leading operators. Loblaw’s PC Optimum program generates personalized offers based on individual purchase history, driving higher loyalty-app engagement and basket size. For regional chains without billion-dollar data science budgets, tools like Datawiz provide the same analytical capability at a fraction of the cost and implementation time.
Step 4: Monitor Price Sensitivity Continuously
Inflation is not a one-time event to respond to and move on. In the Canadian market, food price pressures have been persistent and volatile since 2022, and are expected to remain elevated through 2026. Basket composition shifts in real time as prices change.
This means price sensitivity monitoring must be an ongoing operational process, not an annual category review. Specifically:
• Track substitution rates at the SKU level weekly, not monthly
• Flag any national-brand product losing basket frequency faster than its category average
• Monitor your private-label share gains by category: are your own brands capturing the substitution, or is it going to a competitor?
• Benchmark your promotional lift against category norms: if a 20% discount on a product used to generate a 35% sales lift and now generates only 12%, the promotional mechanic has lost effectiveness and needs to be redesigned
How Datawiz Works in Practice
Here is what basket analysis looks like when it moves from report to result.
- A Western Canada chain filters Datawiz'sbasket data for weekend evenings and discovers that premium cheese and craft beer co-purchase rates spike 340% on Fridays. They move the categories to adjacent aisles and see a 12% lift in combined category revenue within three weeks.
- A Quebec discount banner uses 3D basket analysis to find that bulk detergent, instant noodles, and energy drinks form a recurring basket cluster — one targeted bundle promotion converts that insight into a 9% increase in average transaction value for that segment.
- An Ontario regional chain runs a 24-hour timing analysis and finds its top-affinity products are consistently out of stock by 5 pm on weekdays. Adjusting the replenishment schedule eliminates the gap and the lost sales that came with it.
If your transaction data is sitting unused while your margins compress, it is time to change that.


 Nie potrzebna karta bankowa!