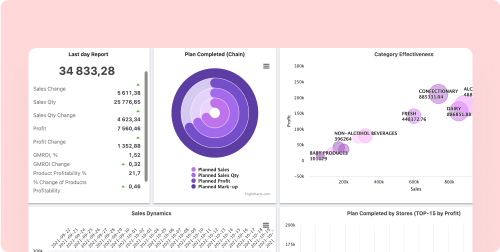
Dashboards - Key chain KPIs
Keep your finger on the pulse of your chain's key metrics. Monitor the quantity of sales, receipts, keep track of chain and store-by-store plans
Easily create BI dashboards and quickly explore business processes using visualized data
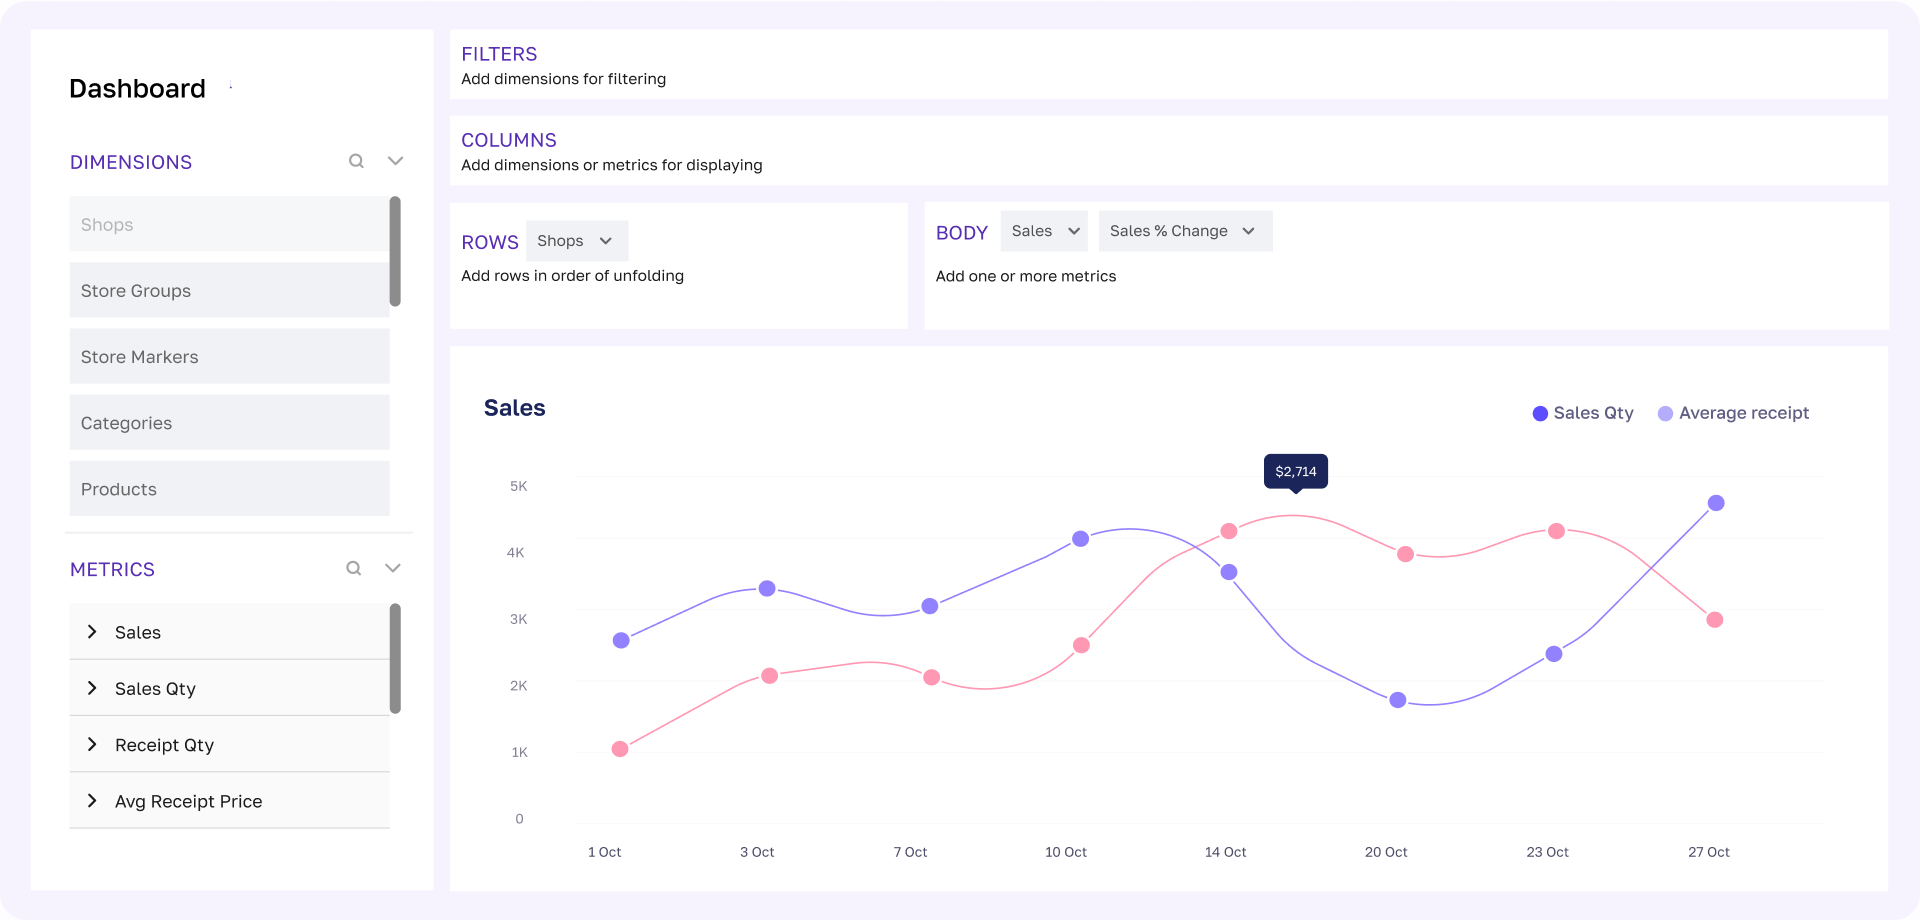
Use BI dashboards to study and improve every process of the retail chain
Create visualisations based on 17 different layout options: charts, tables, graphs. Unlock the potential of your data, work with colour and display style


Share your dashboards and visualizations with colleagues and platform users. Manage access levels in a few clicks


Use ready-made, customized metrics for visualization or create your own. Combine and compare data, easily customize the necessary sections on each dashboard


Create interactive dashboards easily thanks to a concise, intuitive interface: drag-and-drop technology allows to take data into the desired blocks, columns, filters


Keep your finger on the pulse of your chain's key metrics. Monitor the quantity of sales, receipts, keep track of chain and store-by-store plans
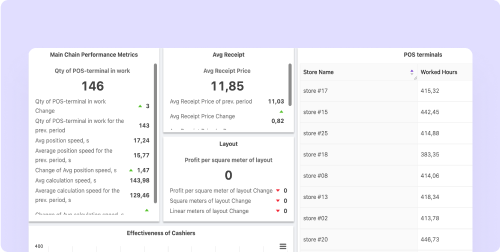
Analyze the stores performing like the palm of your hand! Evaluate cashier performance during peak traffic hours. Keep track of your point-of-sale plan and the efficiency of each product category
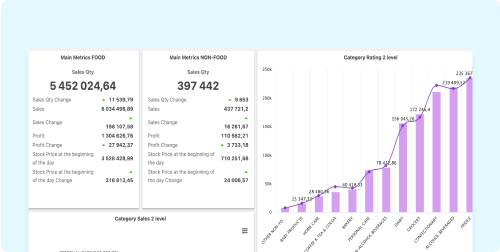
Get detailed information on the turnover of each SKU in your chain. Keep track of sales and turnover of each category. Rank categories by sales and adjust the assortment according to the dynamics
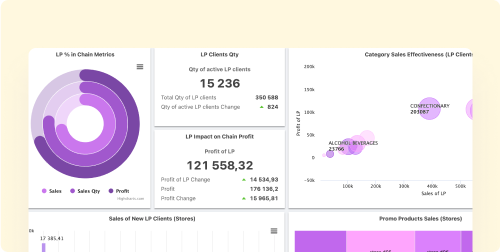
Analyze your loyalty program data point by point. Calculate profits and analyze which promotional items are in the highest demand. Analyze your customers to improve customer experience and make more personalized offers
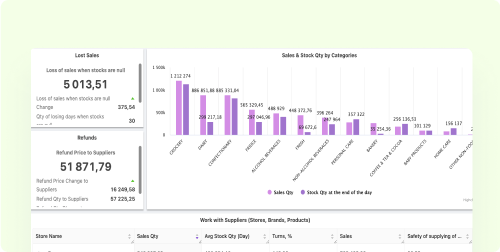
Establish cooperation with your suppliers! Check the effectiveness of your suppliers with sales reports on their categories. Organize timely deliveries and adjust the assortment based on the sales quantity, their structure, and stocks
The Builder data visualisation tool on the BES platform is a useful instrument for assessing the efficiency of chain workflows
Create dashboards quickly and efficiently using drag-and-drop technology, display data at the desired levels and sections, and analyse information presented in the form of dynamic charts and graphs
Data analysis with Builder dashboards from Datawiz is all about analysing the past, monitoring the present and adjusting your company's future
Book a demo