#StandWithUkraine
Click to support

Descriptive Analytics

Extend business intelligence across your organization and accelerate the chain growth!

SALES SALES QTY PROFIT 629.184 21.11.2022 +0.337% 36 416.308 21.11.2022 -1.337% 98 420.477 21.11.2022 +0.134% Store №8 Store №23 Store № 2 Store №26 Store №9 Store №15 Store №11 30 20 10 0 -10 -20 -30 Sales % Change Receipt Qty % Change Profit % Change BUSINESS INTELLIGENCE Main Rules FAVORITES LABORATORY REPORTS DASHBOARD For 21.11.2022 Last 7 days Last 30 days Last 90 days Manager BY SALES -15.713% 69.455% Completed PLAN 20 482 343,371 March 2022 28.846% EXPECTED COMPLETION 81,031% March 2022 -4.137% 75 50 25 0 Store №8 Store №23 Store №2 Store №26 TOP SHOPS BY COMPLETING THE PLAN 47.739 45.627 43.436 45.865 1200 960 720 480 240 0 22.01 24.01 26.01 28.01 30.01 01.02 Problem products Problematic Solved 14 days
Store №1 Drinks Coca-cola Pepsi Fanta Doctor Pepper -3,74 5,79 -9,31 -9,08 -37,89 16,19 45 805 178,99 2 725 089,25 510 529,27 507 711,04 2 818,23 4 918,45 Name Sales value Sales value changes

Multilevel reports

Use multilevel reports to get powerful insights at different levels of detail

Visualizations

Complement your solutions with real metrics and sales trend visualizations

$3,348 1,348 sales

Insights

Get data-driven insights across all business processes in your chain

Descriptive analytics on BES services

BES platform reports provide a wide variety of metrics (profit, average receipt, GMROI) and visualizations that allow you to look at the situation from different angles. They can be detailed by different time intervals and sections. It allows you to understand what is happening in stores (categories, brands), identify weaknesses, and effectively manage all business processes
Store №8 Store №23 Store № 2 Store №26 Store №9 Store №15 Store №11 30 20 10 0 -10 -20 -30 Sales % Change Receipt Qty % Change Profit % Change Main Rules FAVORITES LABORATORY REPORTS DASHBOARD For 21.11.2022 Last 7 days Last 30 days Last 90 days Manager BY SALES -23.609% 44.382% Completed PLAN 22 626 131.766 21.11.2022 +56.513% EXPECTED COMPLETION 22 626 131.766 21.11.2022 +5.109% 75 50 25 0 Store №8 Store №23 Store №2 Store №26 TOP SHOPS BY COMPLETING THE PLAN 47.739 45.627 43.436 45.865 36 416.308 21.11.2022 -1.337% SALES QTY 98 420.477 21.11.2022 +0.134% PROFIT 629.184 21.11.2022 +0.337% SALES

Use insights to scale your business

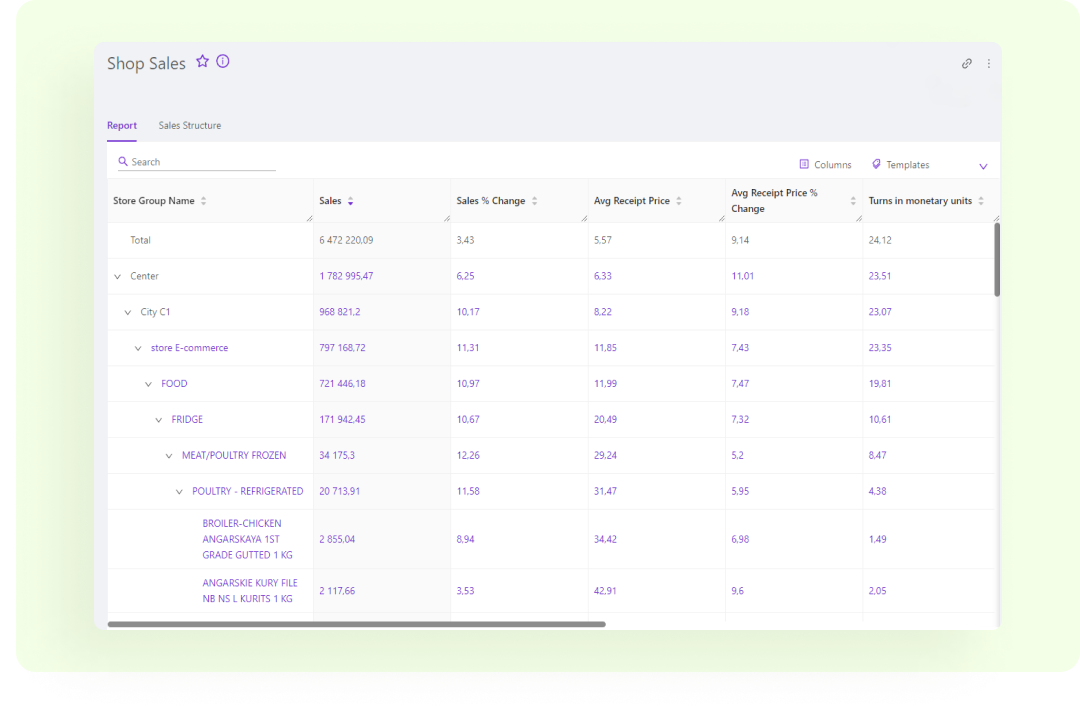
Sales reports

Sales Reports are a set of analytic reports with vital metrics and data visualizations that will reveal all aspects of store operation from different angles.

Go beyond standard business intelligence and empower all your employees by integrating smart tools into workflows that will accelerate business growth by up to 15-20%.

2018 2017 2019 2020 2021 2022 0 1M 2M 3M Annual Sales statistic Statistics 1 Oct 3 Oct 7 Oct 10 Oct 14 Oct 20 Oct 23 Oct 27 Oct 30 Oct 0 1k 2k 3k 4k $2,714 Year Month Week Day Average receipt Sales Qty Sales Statistics

Assortment reports

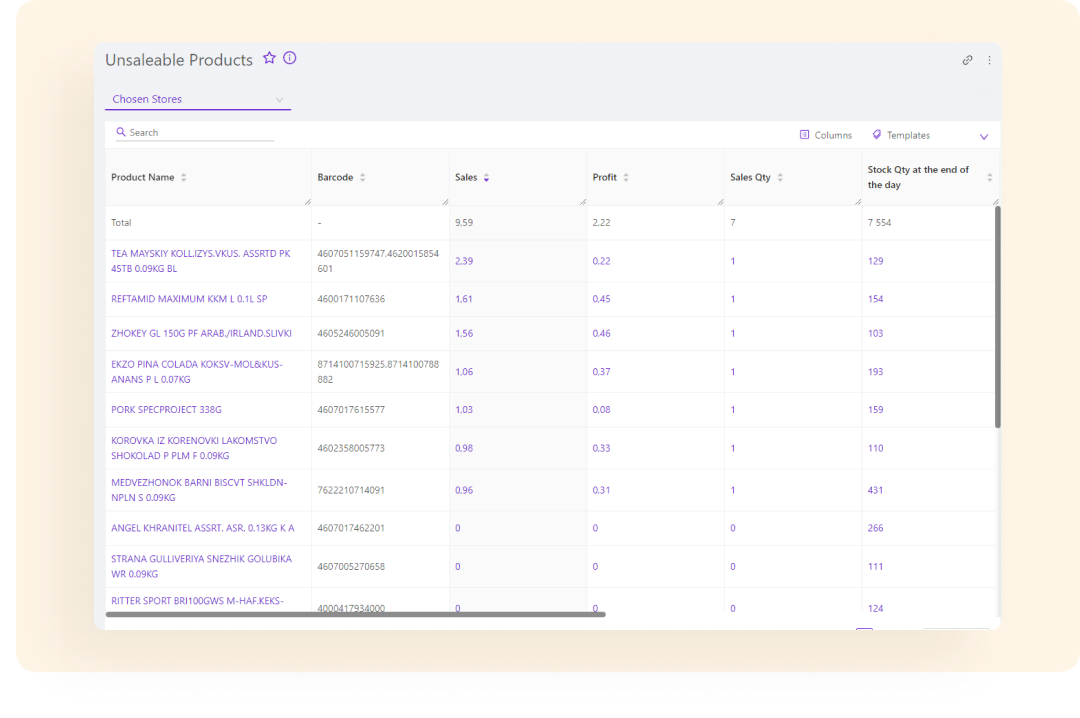
Managing the product assortment allows you to increase chain sales up to 5-7% quickly and without additional costs. Reports of the analytical platform BES are equipped with the most effective tools: ABC/XYZ analysis, BCG matrix, cumulative curve, and various visualizations. They will become your indispensable assistants in optimizing the assortment policy.

Take the guesswork out of data and improve the productivity of every category manager

0 2 4 6 8 10 12 14 16 18 20 Cumulative curve +2.45% 100 75 25 0 Dairy products Meat and fish Drinks Fruits and vegetables 11% 24% 26% 39% Assortment Statistics

Reports to evaluate the effectiveness of the Loyalty Program

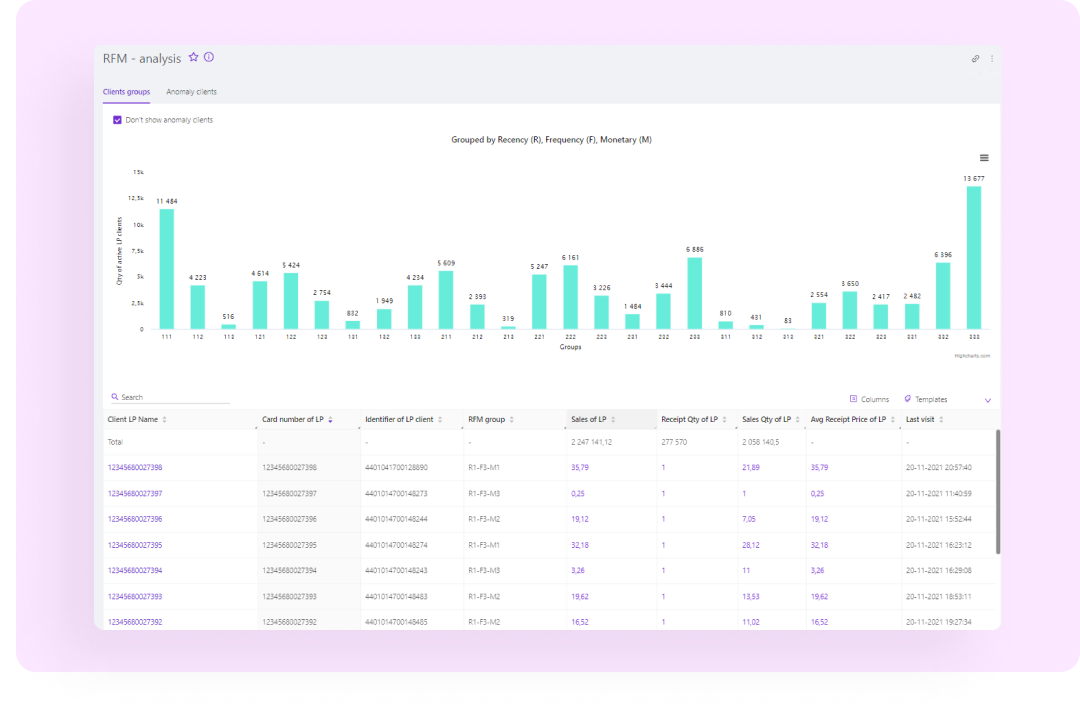
Customer Analytics from BES are relevant and complete data about all your customers. With their help, you can build an effective strategy for interacting with customers.

Flexible customer segmentation of the loyalty program will allow you to identify the most valuable customers, effective regions and the most popular product or category.

Such information will help you develop high-impact targeted marketing and increase profit by 1.5 times. Loyalty program reports make it easy to prepare, evaluate and visualize Big Data for all chain customers, identify patterns in their purchasing behavior (average receipt, shopping carts), attract up to 25% more customers and maximize margin

0M 5M 10M 20M 25M East West North South Center Turnover Turnover program dynamics Loyalty program dynamics Statistics

KPI assessment reports

Develop realistic plans for your stores and employees and track them in real time with BES analytics platform reports. Planning is one of the most difficult processes for a manager. We propose to entrust this task to the smart algorithms of our service. The current control of KPI for stores will help you to avoid failures and underfulfillment of sales plans, which will increase efficiency up to 17%.

Establishing and tracking KPI of category managers and cashiers will not only increase the efficiency of staff work, but also grow sales, improve supplies, and make a better chain reputation

+6.78% Plan +19.71% Expected completion Completed 80% Plan by Sales Statistics

Chain Life Monitoring Reports

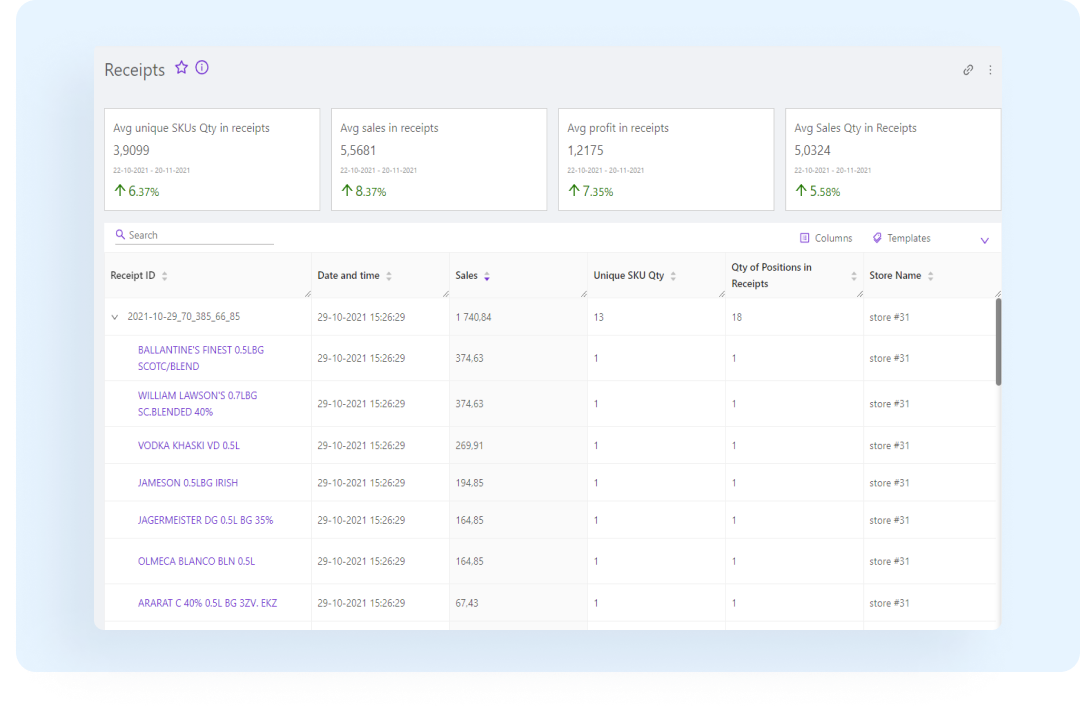
Keep all business processes under control. With BES reporting, you'll always be aware of how much stock exists in the warehouse, what items need to be stocked, what the "behavior" of new SKUs is, and how effective promotions are. Reports will allow you to identify overstocks or out-of-stock in time, prevent lost sales, select winning strategies at the product, brand or store level.

Reduce costs by 15-17% and maximize profitability, get important information in time and react to it to be one step ahead of competitors

MON TUE WED THU FRI SAT SUN 0 1K 2K 3k 4k 2.3M 3.1M Stock Qty Sales Qty Out-of-stock Statistics tore №6 S tore №6 S tore №6 S tore №6 S tore №6 S tore №6 S tore №6 S tore №6 S tore №6 S tore №6 S 0 5 10 15 20 25 30 3 897 13 343 5 934 6 876 19 611 12 456 3 897 19 611 13 343 4 566 Sales % Change Statistics Leaders Outsiders

More technologies

AI Technologies

In-depth analysis based on AI technologies

Read more
Data Visualization

Quick analysis based on interactive dashboards

Read more
Mobile Analytics

Insights and data from the entire chain in your smartphone

Read more