 What's new?
 14 days trial period
 no card required
Ready to try a free Datawiz BI demo?
With our demo version, you have the opportunity to dive deep into all aspects of Business Intelligence and experience the full power of our service.
Datawiz BI transforms all your data into profit: get ready-made reports and AI insights to optimize your product range, pricing, and promotions.
Wizora is your AI-powered retail analyst — created to answer, explain, and uncover what’s really happening in your business. From sales drops to inventory blind spots, Wizora turns your store data into clear, actionable insights — no digging through reports. Just smart answers, for smarter decisions.
Explore Wizora
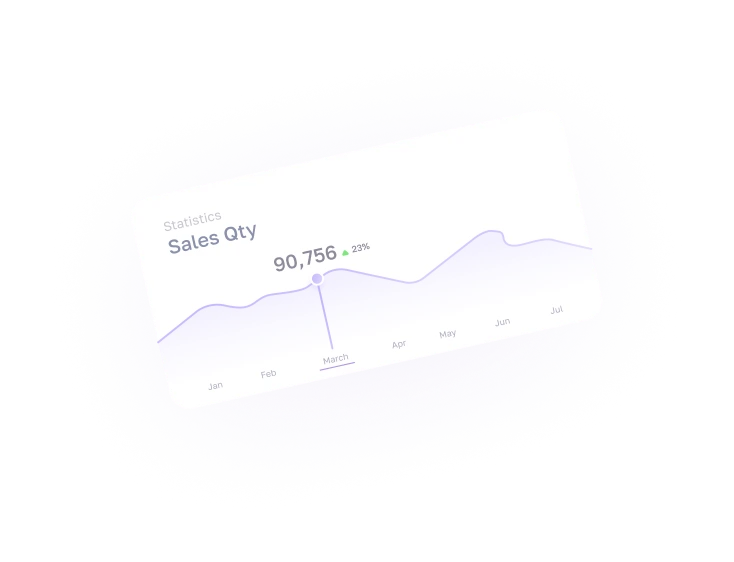
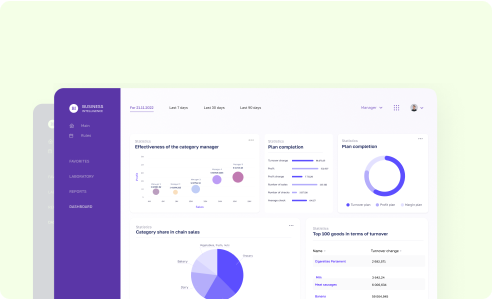
Understand your business performance across the entire retail chains. The Sales Reports help you see how every store, category, or product contributes to total revenue.
Solves: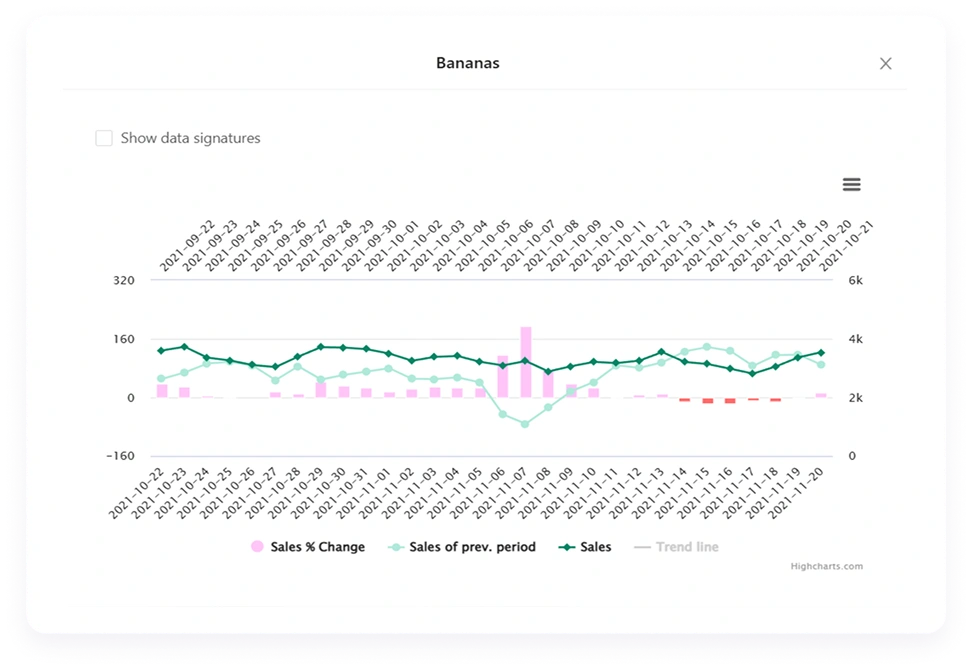
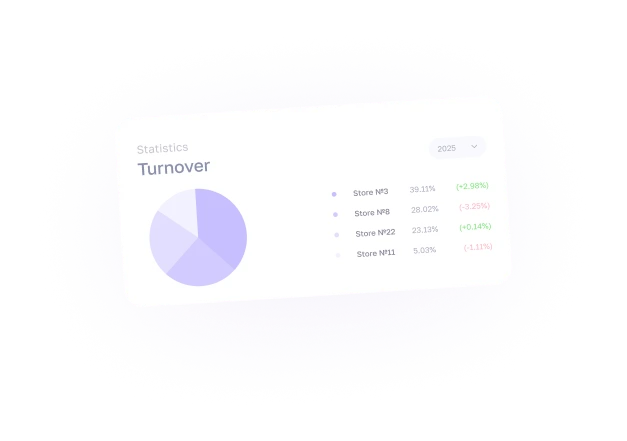
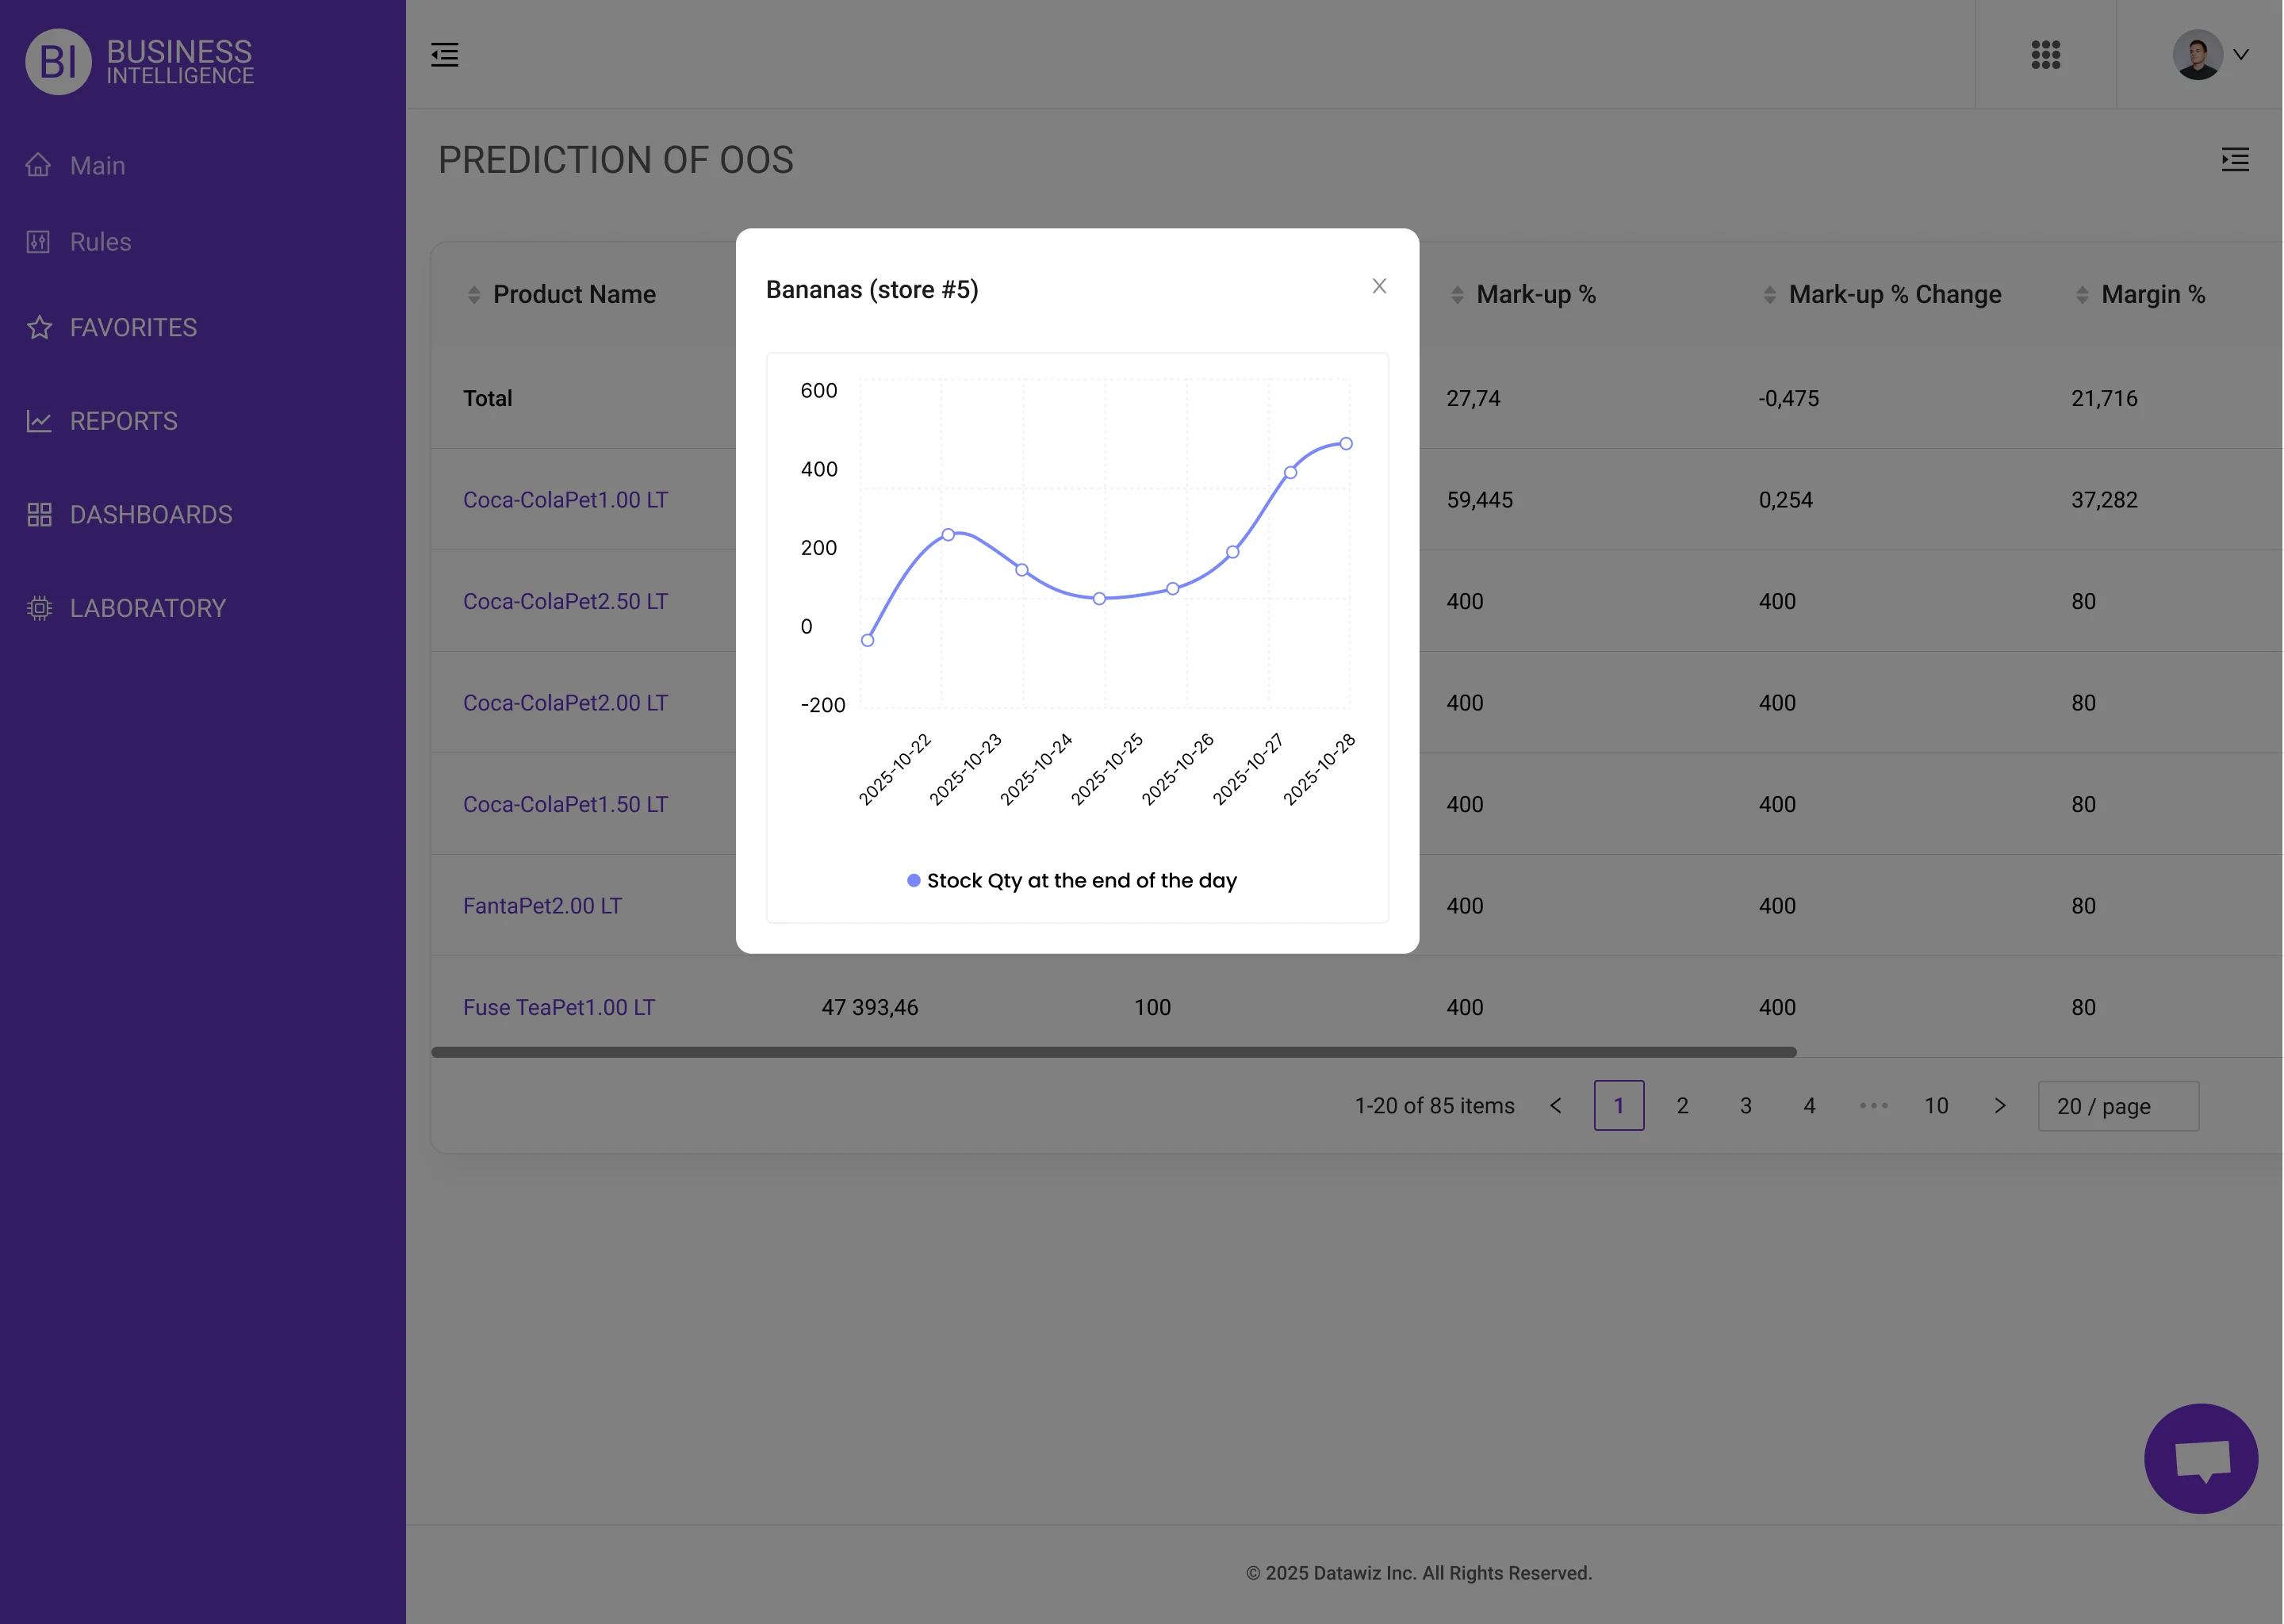
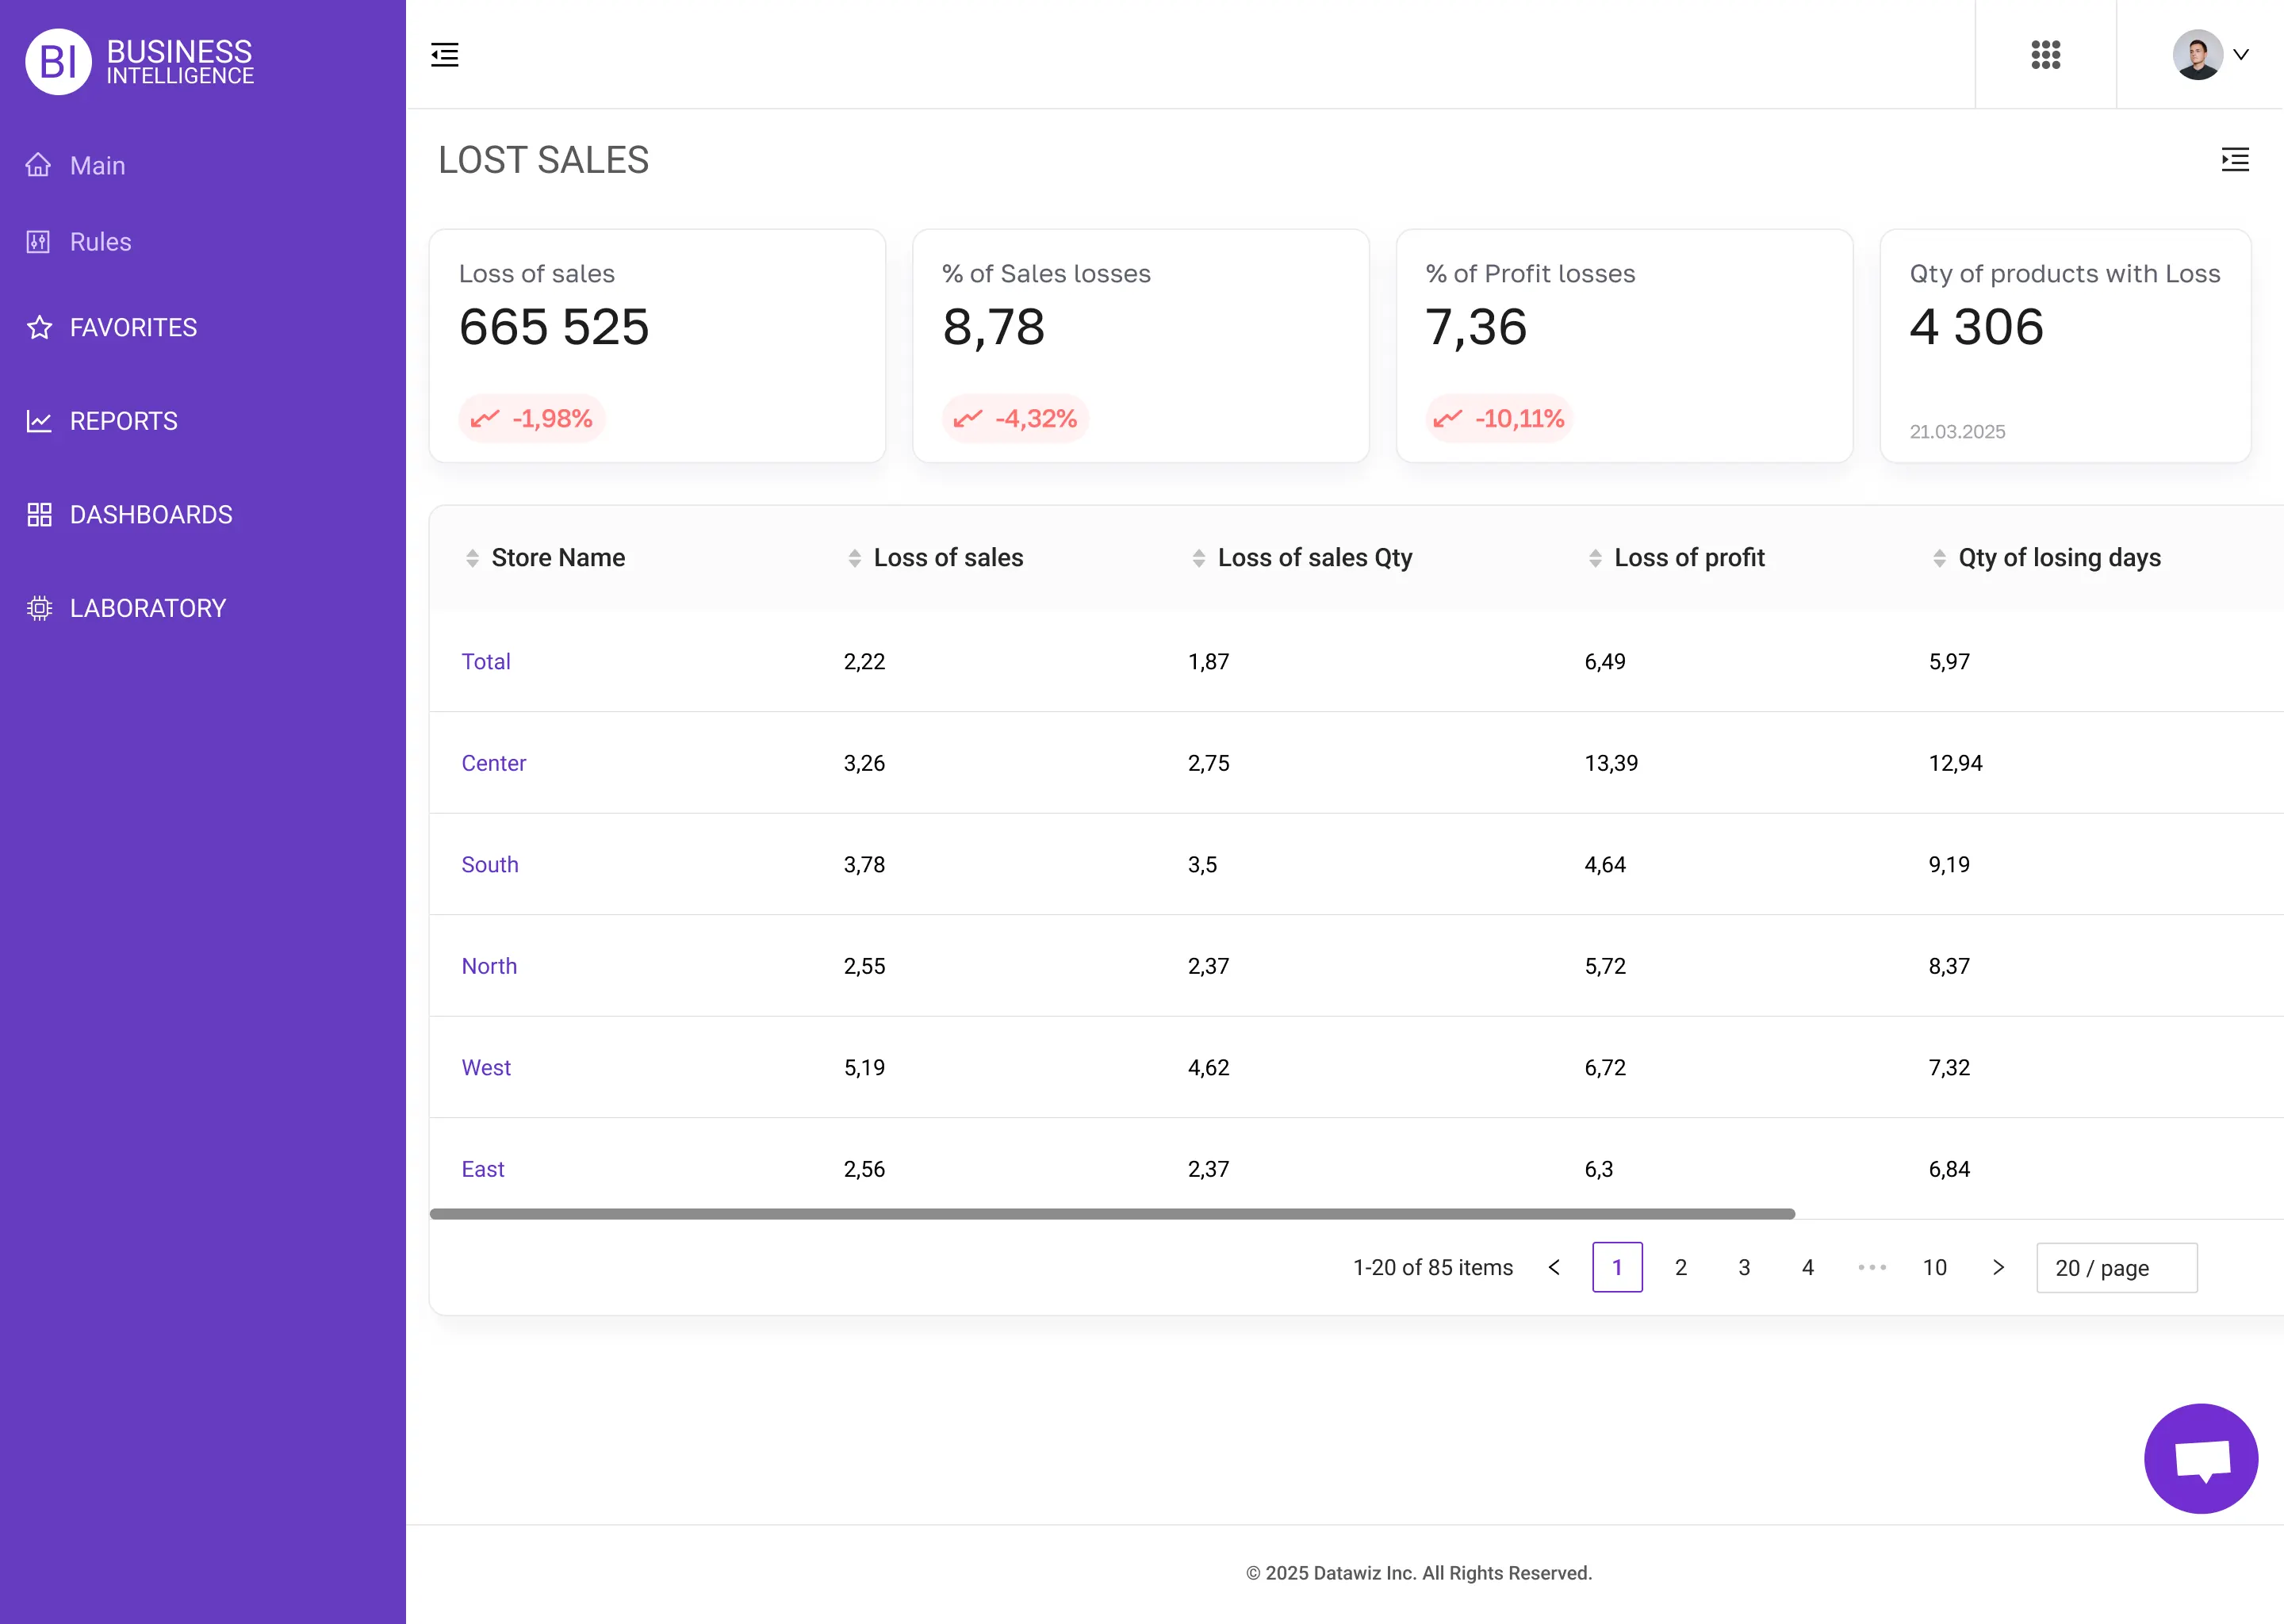
Stay in control of your stock - without tying up cash. Datawiz BI shows the real picture of stock levels and product turnover across your entire chain.
Solves: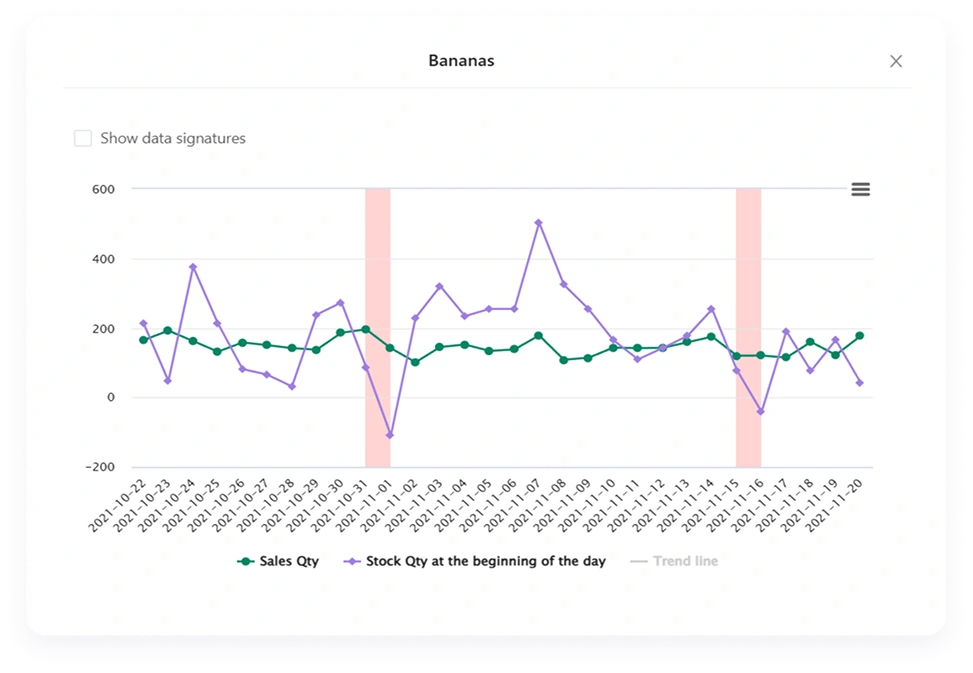
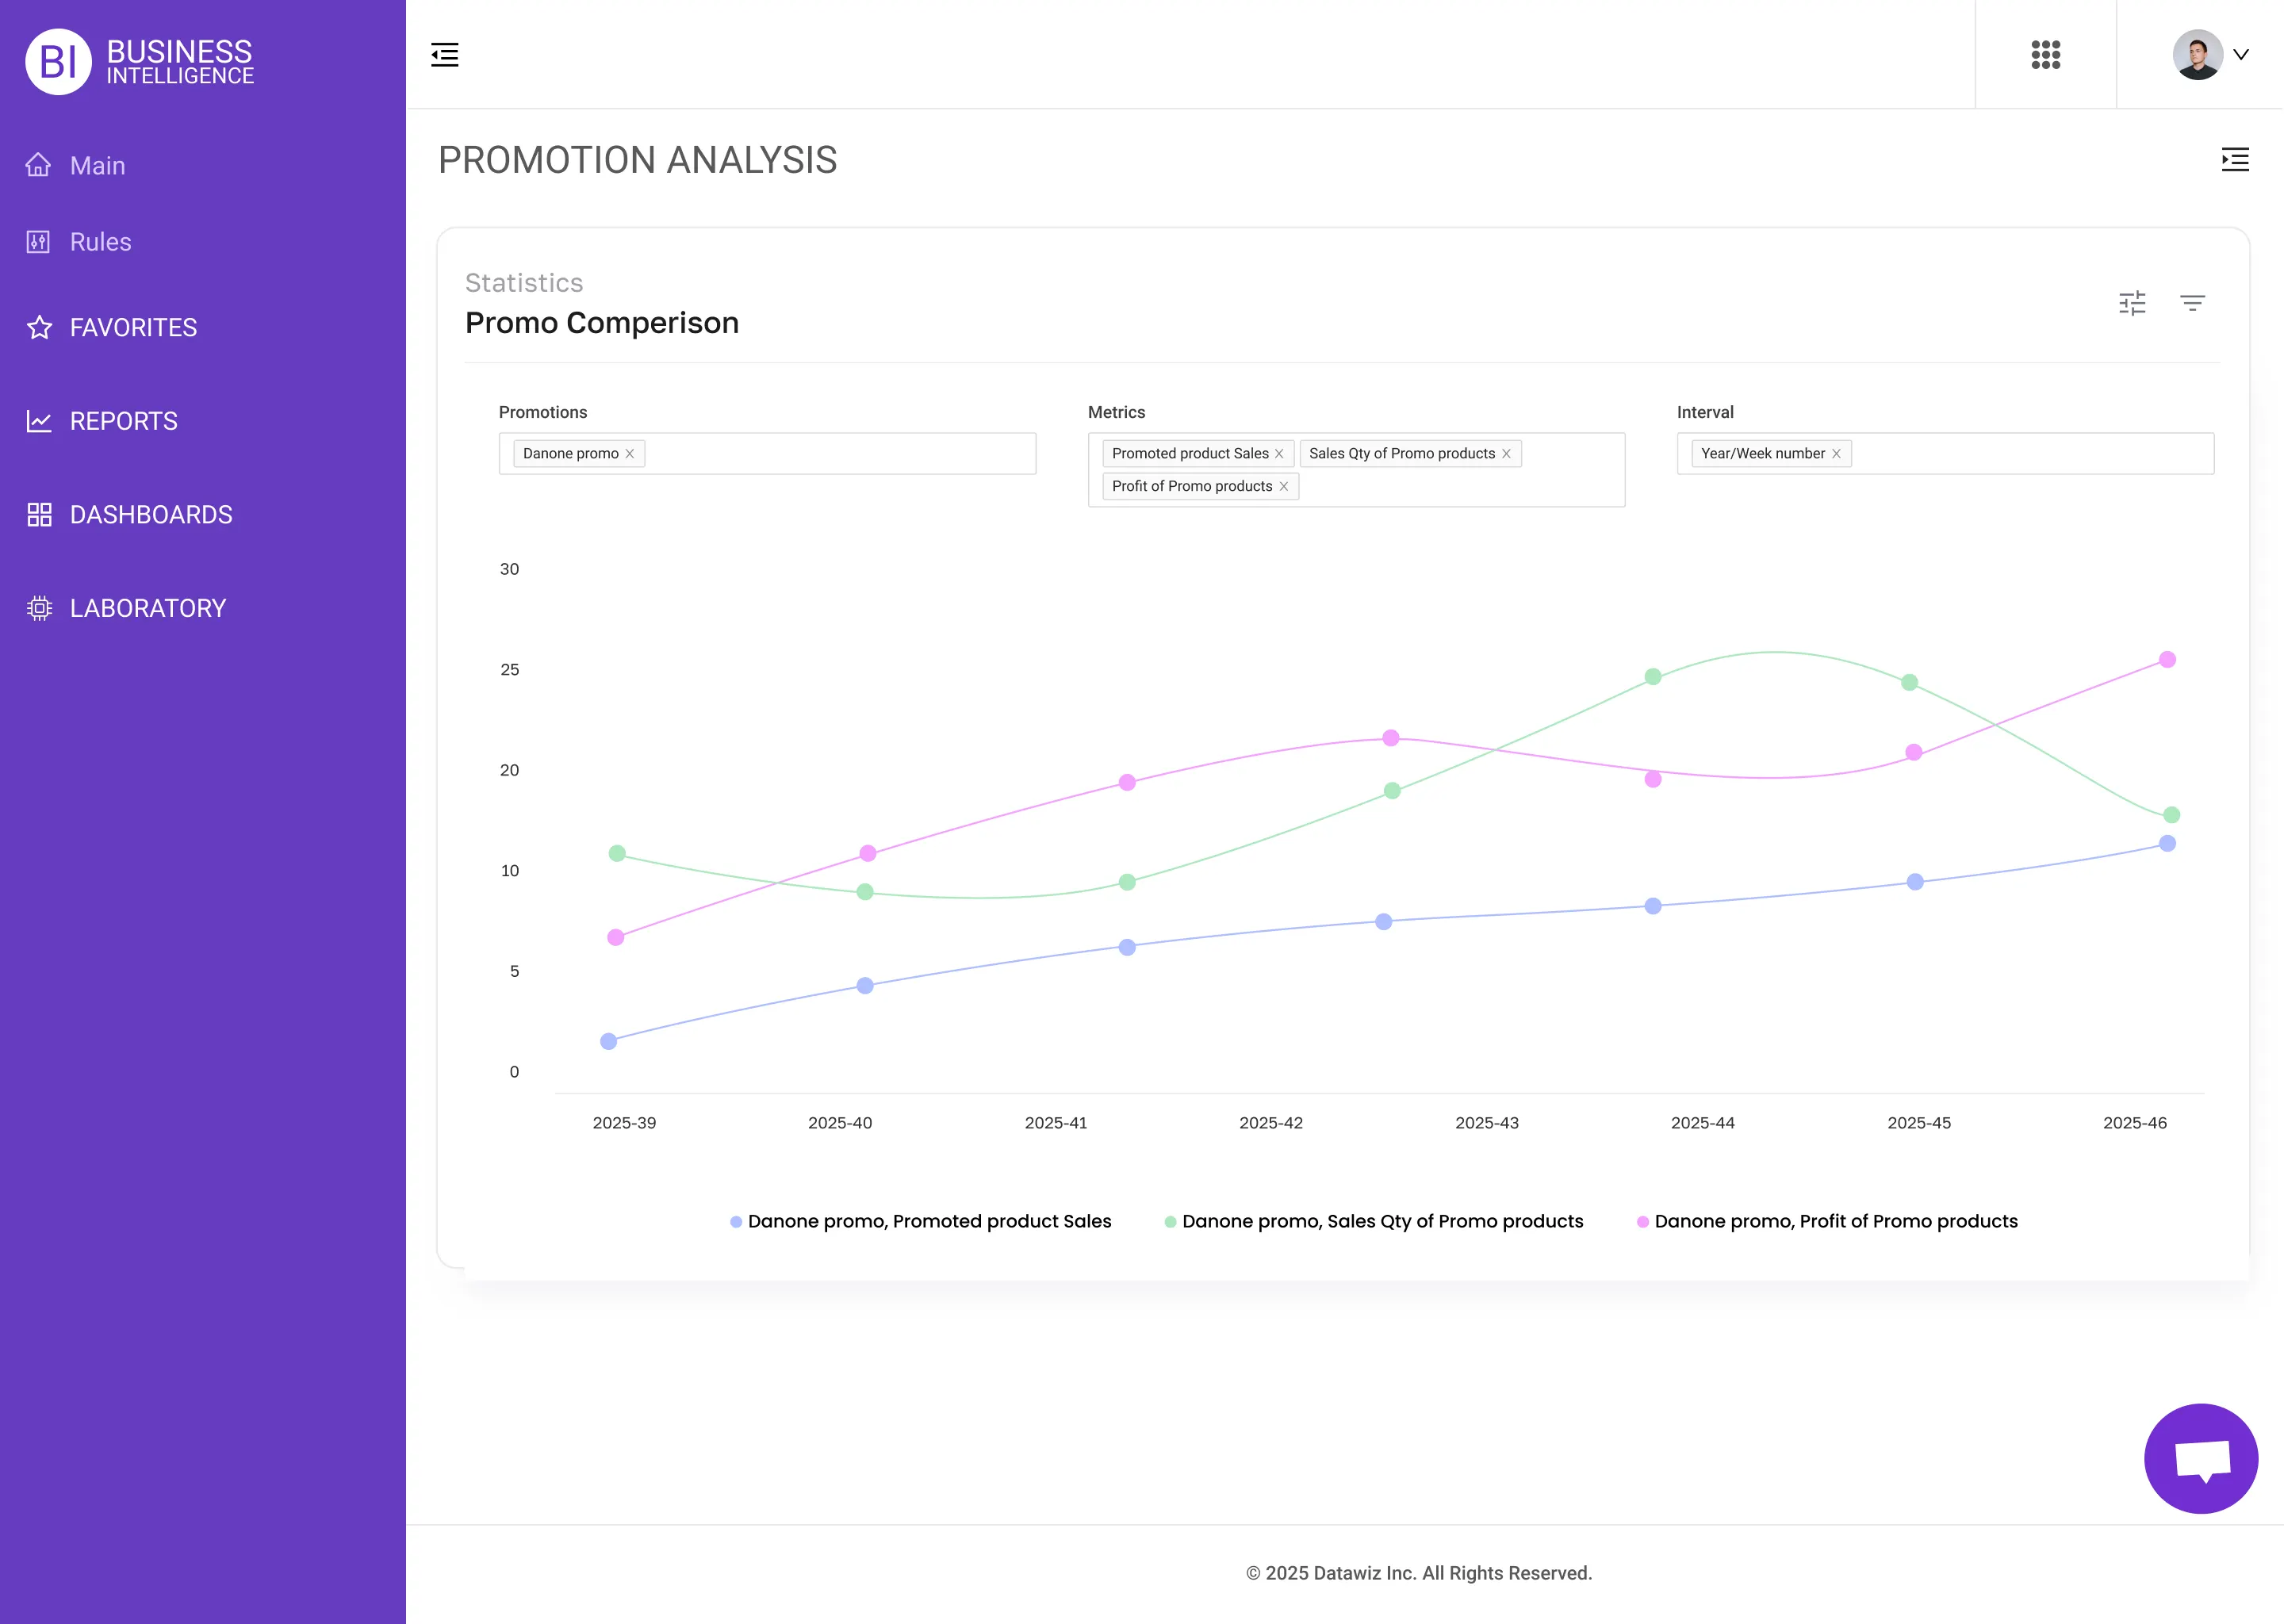
See which in-store promotions actually work. It helps you measure the true impact of every offline campaign.
Solves: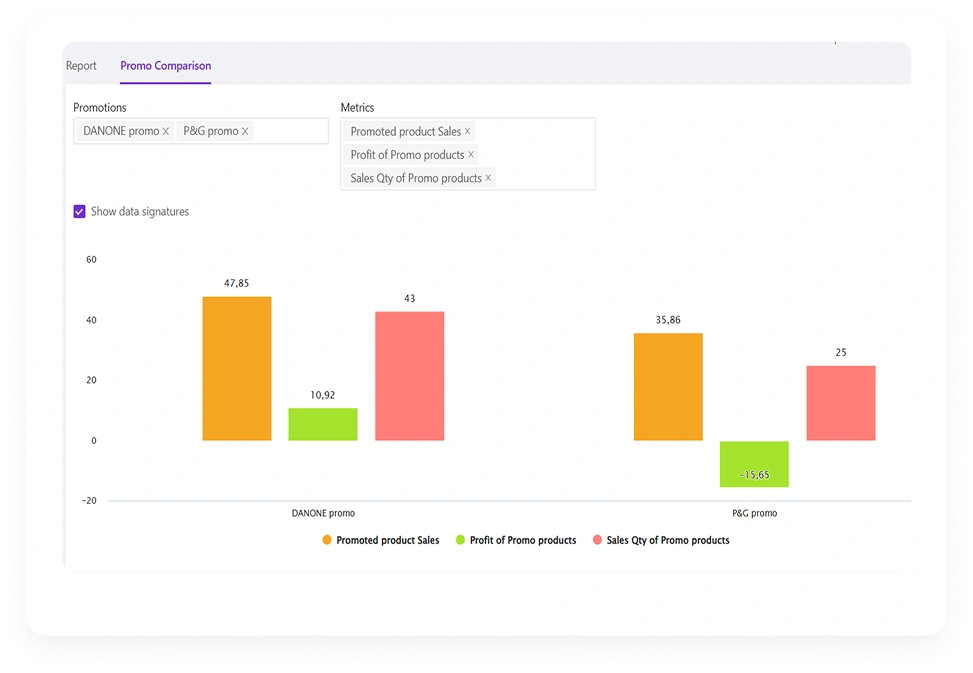
Evaluate supplier performance based on data, not assumptions. The Suppliers Reports show how each partner contributes to your sales and profit.
Solves: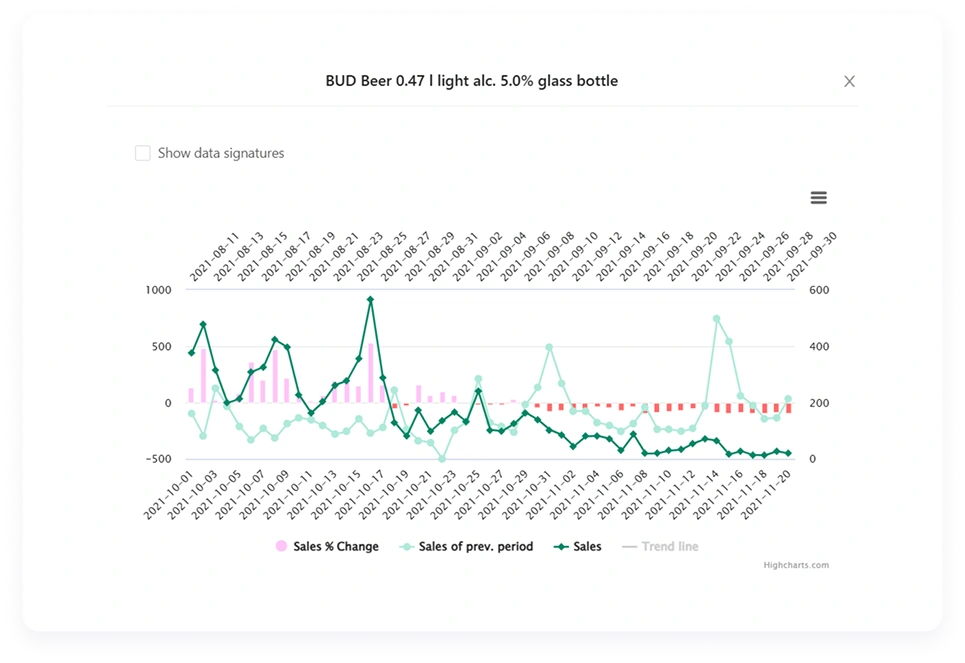
Track your team and store performance in one place. You can monitor key retail metrics - sales, profit, turnover, and margin.
Solves: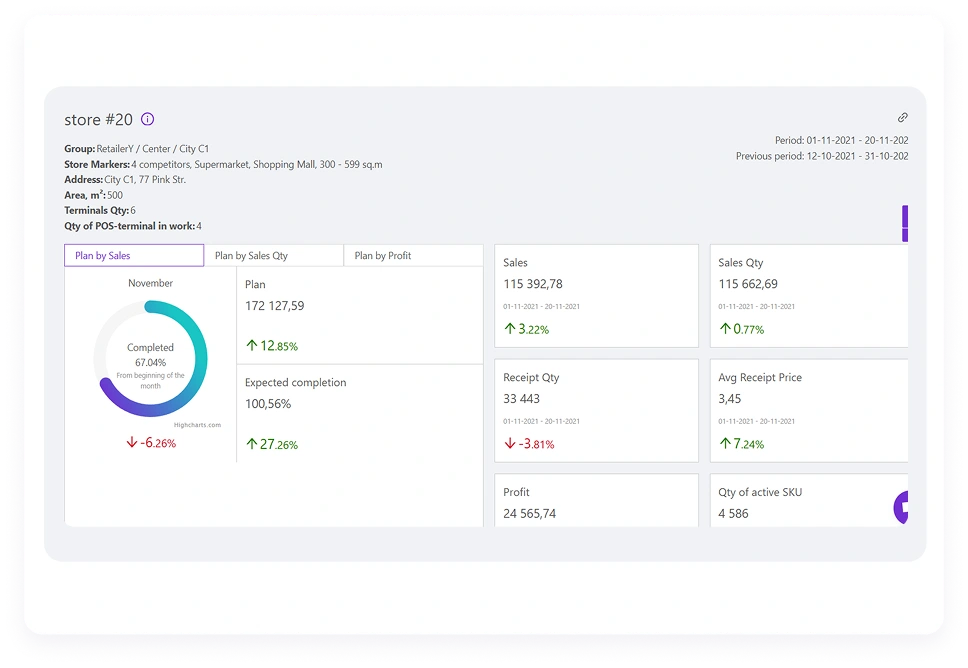
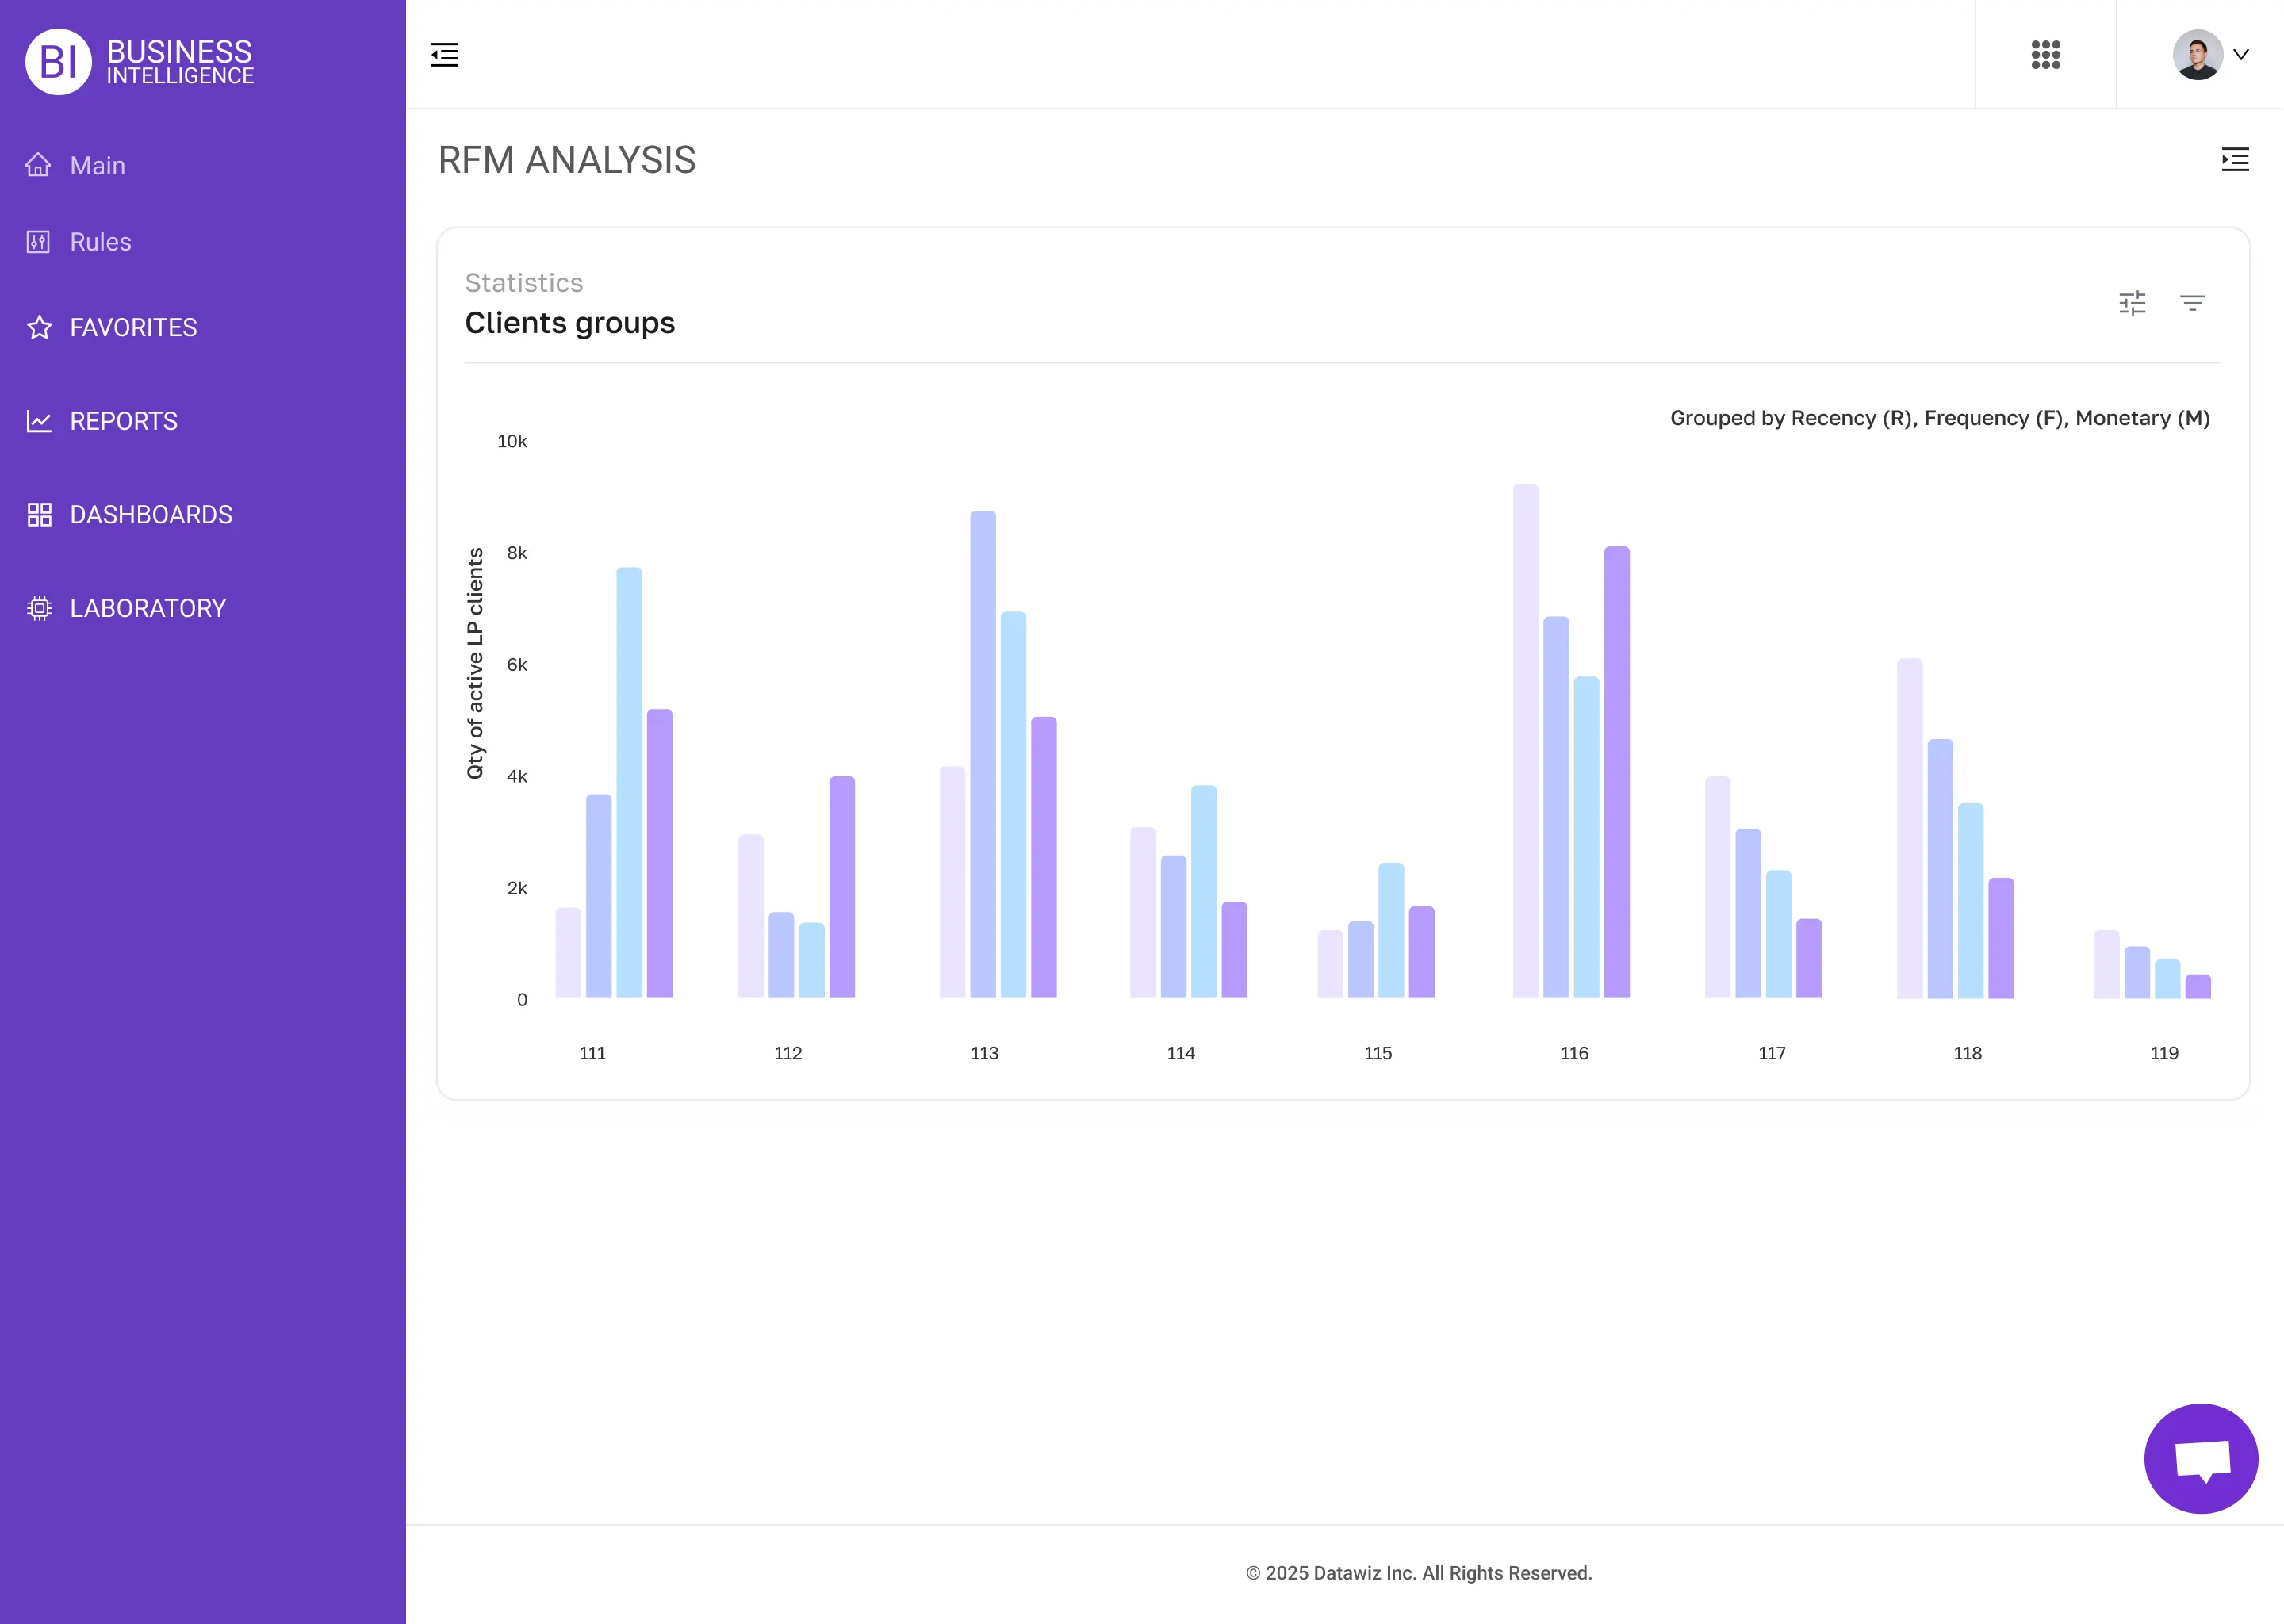
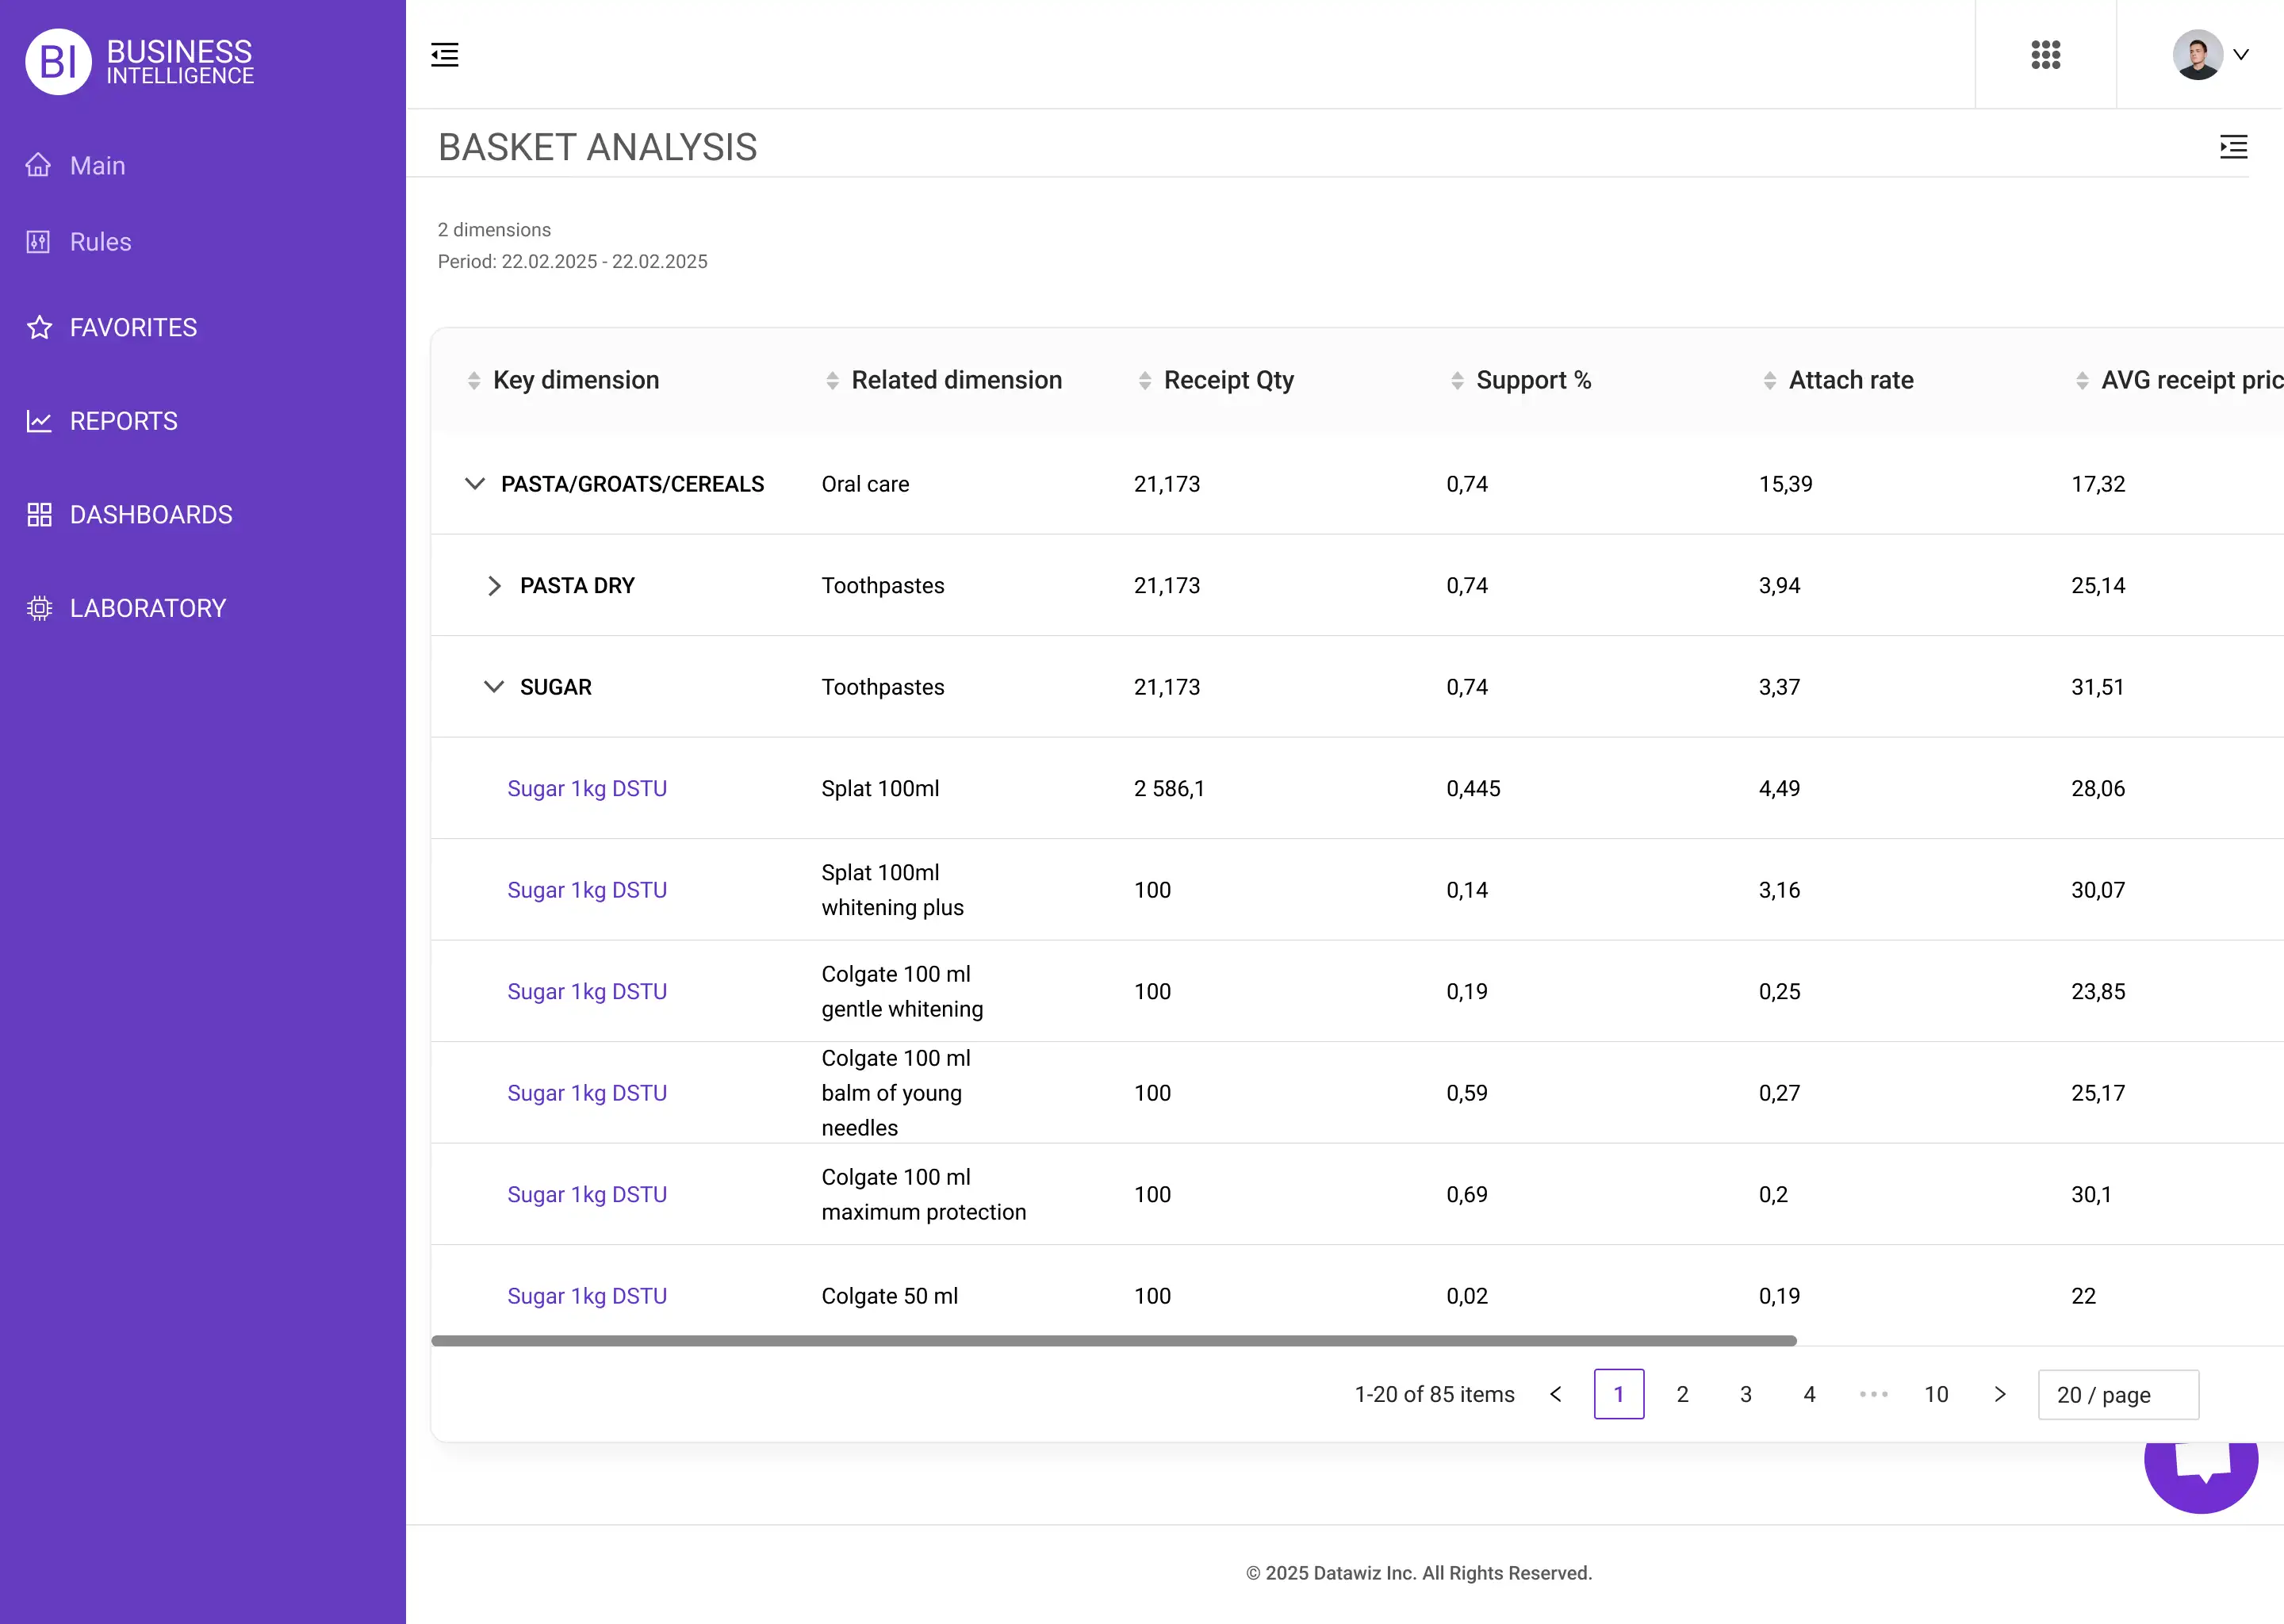
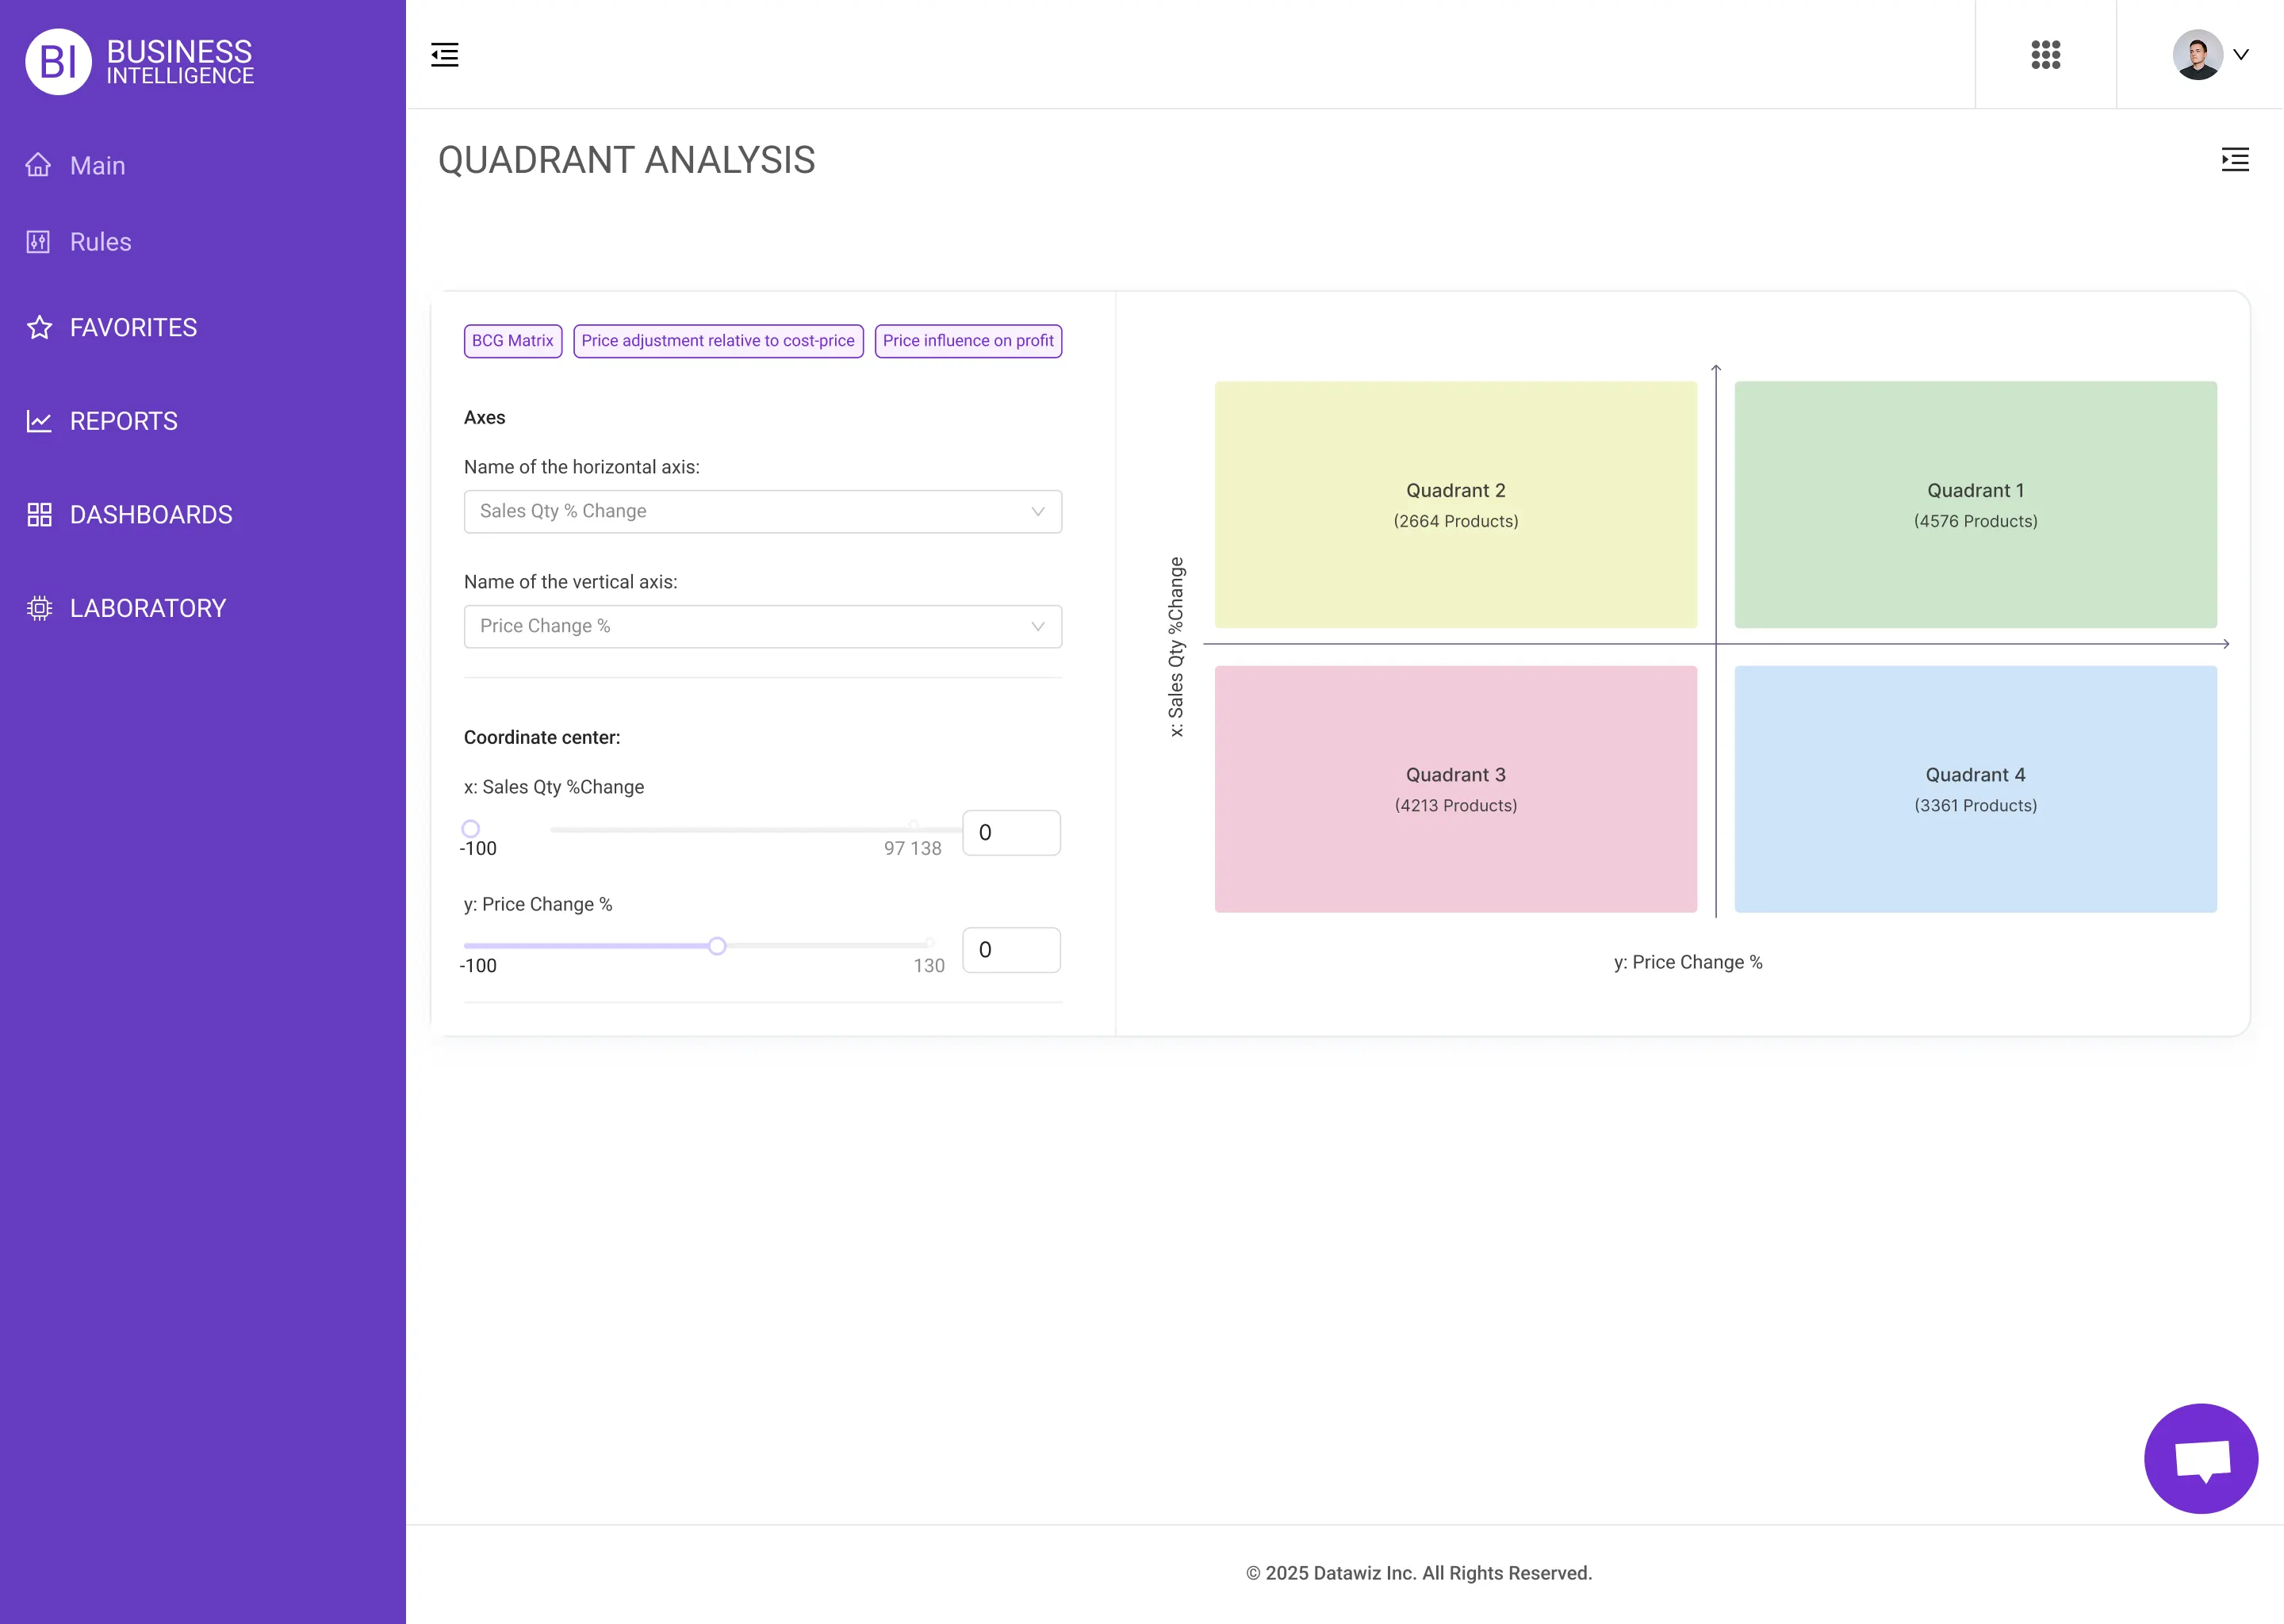
Understand what shoppers really buy and why. This reports reveal product combinations, basket composition, and shopping patterns by hour or day - helping you optimize product placement and store layout.
Solves: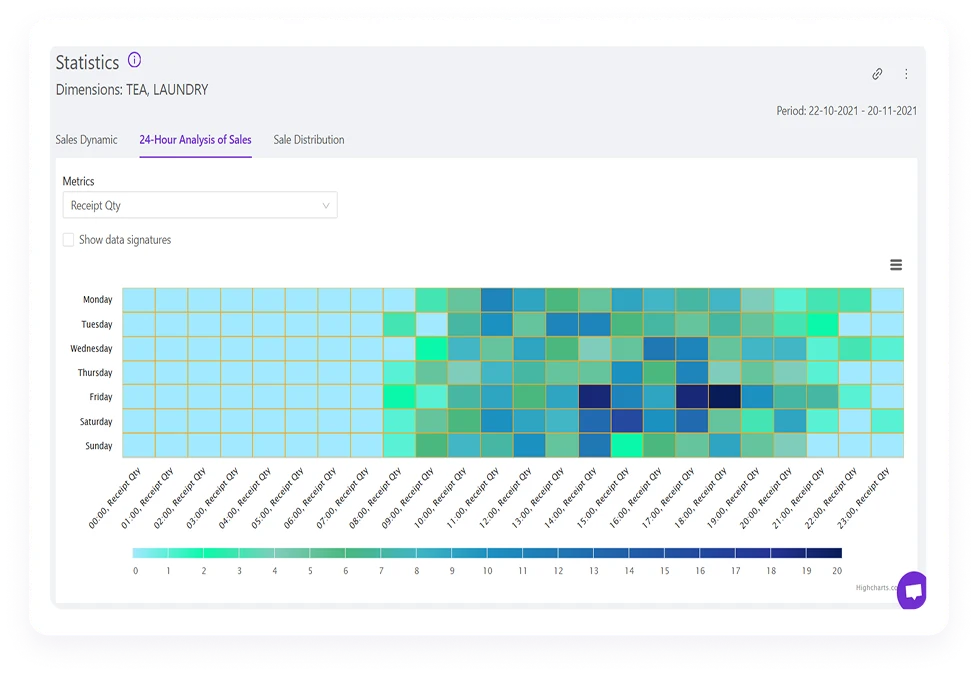
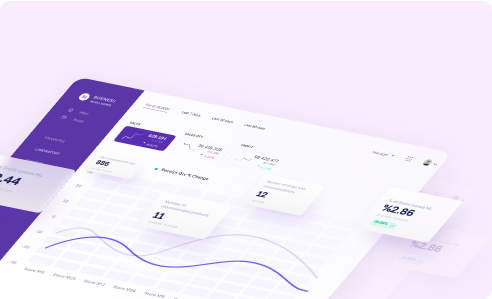
Quickly visualize your data with the easy-to-use drag-and-drop design builder. Customize the design to suit your needs or choose from 17 available templates. Try it, feel it, evaluate it!
14 days trial periodno card requiredWith our demo version, you have the opportunity to dive deep into all aspects of Business Intelligence and experience the full power of our service.
Confidently explore data on your own and share reports with colleagues.
Companies that have already implemented Datawiz BI, operating in retail, supply chain, and manufacturing sectors, share their experience with the service

Thanks to BES, we have a new perspective on self-service in analytical needs: in the face of constantly changing analytical tasks and needs, when, for example, a list of new tasks appears at a regular meeting, business customers do not need to assign tasks to IT or BI analysts to develop reports, they can customize the necessary reports or dashboards in the builder without any special knowledge of BI tools, in an intuitive interface.
Head of Supply Chain Analytics, Avrora

Datawiz BUILDER is a convenient tool for reporting and data visualization. The main advantage for us is the ability to collect the necessary data in a few clicks without unnecessary information. Recent case study: we used BUILDER for hourly sales analysis, which allowed us to optimize our employees' work and increase our team's efficiency.
Business Analyst of Promotion at «Korzinka» store chain

We mainly use Datawiz BI for operational and commercial reporting. We use daily sales reports by regions, cities, and stores, breaking down data by categories and subcategories. We compare sales metrics, analyze promo sales, and use supplier sales reports for annual negotiations. BI makes it much easier to monitor the sales plan and store performance. Now we can quickly find hidden problems and look for solutions. I recommend Datawiz BI for anyone who faces the challenges of analyzing large amounts of data.
CFO at Daily

Datawiz BI is a convenient, affordable, and intuitive tool for store analytics. We use the reports to analyze sales of goods and categories. We also analyze lost sales and compare sales across the chain and the performance of checkouts. BI reports help us respond to changes in time and influence the results.
Head of Operations at Torba retail chain

Datawiz BI is a powerful tool we have used successfully for several years. BI helps us receive detailed sales statistics, which allows us to better understand the needs of our customers and optimize our product range. We also use the service's reports to develop marketing campaigns and promotions to increase sales. Datawiz BI helps us increase efficiency and stay competitive.
Commercial Director of Taistra Group
We use Datawiz BI to analyze sales by store and visualize the data with Dashboard Builder. Sales graphs by product provide a lot of insight, speeding up the process of determining the causes of correlations. Datawiz BI quickly displays graphs with no need to upload data, thus saving time and making the service convenient and easy to use.
Commercial Analyst at «Korzinka» store chain

The BI service allows us to analyze sales and compare their dynamics across the chain. Datawiz Kate Telegram bot saves time for sales analysis. The ability to quickly obtain data is beneficial, even if you don't have access to your workplace. We use BI reports to work with stocks, inventory, and unsold items, which allows us to make crucial decisions quickly.
Head of Business Intelligence at Bulka Market

Datawiz BI helps to analyze sales across the chain and track the efficiency of each store. Thanks to the service, we can quickly collect and present the necessary data for analysis in convenient dashboards. BI service provides quick access to crucial information and helps make critical decisions based on the data received.
Head of Analytics at TOIMART

I use Datawiz BES on a daily basis to collect the data required for reporting. Here, the dashboards help me with the proper set of metrics and sections. The BI service simplifies complex analysis into simple and easy-to-understand reports. The intuitive interface and prompt support service ensure efficient work with the service.
Analyst at «Vkusnaya Korzinka» LLP
The BI tool allows us to analyze sales and track their dynamics as quickly as possible. With the help of BI, we have identified inefficient use of shelf space, found products with high turnover, and products that do not reach the shelves on time but remain in the warehouse. The BI solution reflects the results of our team's work and allows us to respond quickly to changes. The BES support team is always ready to help with any questions and solve them using real cases.
Project Manager of IT Department, SMK Group
We use the BI service to create product orders, track the quality of procurement, analyze sales, and monitor employees' KPIs. BI reporting allows us to monitor demand dynamics and build analytical reports. Thanks to the service, we can predict and analyze purchases, which helps us determine which products should be procured and which should not be purchased. This is an opportunity to save money and redirect it to other essential processes. We recommend Datawiz BI to other chains to optimize business processes and increase efficiency.
Head of Procurement at MINIMAL
Business intelligence has transformed our retail strategies by providing real-time across multiple platforms, including app and web-based solutions. We heavily rely on the Datawiz BI service for insightful reporting that helps evaluate our chain performance with a focus on store- and category-level KPIs.
Market Intelligence Manager at SHARJAH COOP

We use the Datawiz BES analytics platform, which offers a variety of tools for automation, data analysis, process management, and resource optimization. The analytical tools provide in-depth data analysis and visualization, which contributes to a better understanding of business processes. “Hourly Analysis is especially useful in displaying customer traffic to improve store performance. The BUILDER solution allows you to set up your own customized dashboards, analyze data, and monitor key performance indicators. This significantly improves productivity and decision-making.
Head of Analytics at LotOk

We use BI reporting to track sales in our stores, analyzing them week to week and month to month. We analyze category sales to see the optimal ratio of products in the store. We filter data by offline groups and different store formats. Using data on average sales per day, the number of sales for the period, and end-of-day balances, we create orders to suppliers using our own formulas. Thanks to the reports, we can quickly analyze which stores are experiencing sales growth or decline and make decisions about markdowns and orders. The service significantly saves us time and increases efficiency, allowing us to analyze seasonal sales and product turnover.
Owner of SEZON.

I use analytical BI reports on a daily basis to track the fulfillment of plans, sales dynamics, and comparison with previous periods. I use the Category Sales report most often. Thanks to the analysis, it is easy to plan and adjust the assortment, move products between stores, remove them from the assortment, and make timely purchases of popular items. This saves me time, as it would have taken many times longer to generate reports on my own. The flexibility of the settings makes BI solution convenient for any position, structure, and KPI of the company.
Category Manager, Deputy Commercial Director of UNI Market

We use BI to analyze sales and track Like-for-Like indicators by store, including the number of receipts and average receipts for specific periods. The system allows us to monitor zero SKUs effectively, check whether or not orders are available, and evaluate work with suppliers. Creating visual graphs for presentations will enable you to present information quickly. BI service helps to save time, which, in turn, increases the speed of response to various situations. I recommend the service to other chains because it is convenient, fast and efficient.
Operations Director, GraMad Retail LLP

We use BI service to track daily sales figures, providing detailed reports by product, category, store, date, and more. It helps us understand top-selling products and manage inventory effectively, preventing stockouts. The service saves time and money by providing up-to-date data without manual work. Reports and dashboards can be easily shared with team members, facilitating better collaboration. The intuitive interface allows us to create and modify reports without relying heavily on IT support. I highly recommend BI to other chains for its report customization capabilities, which can greatly enhance operational efficiency.
Category Specialist at Trolley

We use a BI service to monitor KPIs and operational performance of stores. 24/7 access to data helps us analyze marketing activities, sales and manage inventory. BI provides high-quality analytics and facilitates productive interaction between the purchasing department and suppliers. BI service provides convenient data visualization and customization of dashboards for our needs. Thanks to the service, we save time and resources, increasing efficiency. We recommend BI for its user-friendly interface, prompt and competent support center, and good value for money. It is an excellent tool for daily use in a dynamic business.
Head of Marketing at Mego

I regularly use BI service for product sales, supplier analysis, and shop sales. These reports help me with purchasing decisions and planned sales. With real-time insights into product sales, supplier performance, and store success, I can quickly identify top sellers and underperforming items. This helps me decide which products to keep on sale or remove. The speed and accessibility of BI reports make me more productive. Having all the reports in one place is great, and the quick access to information speeds up my decision-making processes. When you are satisfied with the service, it’s only natural to recommend it to others.
Category manager at KTC

BI provides extensive opportunities for data analysis. BI Builder helps us create analytical dashboards that are immediately displayed on screens in meeting rooms using our automated scripts. It is a convenient tool that provides interesting analytics and allows us to generate reports quickly. In addition, we use the PlanoHero service, which provides the necessary functionality for building planograms.
Head of Digital Department at Domashniy

We use Datawiz BI to analyze financial data, optimize sales goals, and manage product assortments through detailed reports. Business Intelligence provides accurate insights into products, suppliers, and sales, allowing us to optimize trading locations, negotiate better with suppliers, and improve stock movement efficiency. By automating data tasks, BI significantly increases employee efficiency, reduces human errors, and allows staff to focus on more strategic activities. We recommend Datawiz BI to all retail chains due to its ease of use, quality, and flexibility.
Manager for Economic Activities at Ukmergė RVK

Our sales department actively uses BI for analytical work. Managers, regional managers, store managers, analysts and merchandisers use it to compare store performance, provide timely information on sales dynamics, the share of product groups and analyze the work of checkouts. The service also helps in making decisions, such as adjusting staff schedules, opening checkouts, and optimizing store opening hours. Thanks to automatically generated reports and dashboards, we save time and increase efficiency. We definitely recommend BI for fast and high-quality analysis.
Head of Sales, Argon chain

Datawiz BES helps us make decisions by providing data-driven insights. It’s proven to be extremely helpful in a variety of situations. We’ve been using the Stock movement to monitor inventory across our stores and the Sales Report to identify missing data. Additionally, BI service enables us to build dashboards and generate reports for each store. With BI system we save a lot of time and effort in creating reports, increasing the efficiency of our operations, and delivering professional reports quickly and effectively. Overall, BI service has improved our workflow, saved time, and increased productivity.
IT- Projects Specialist at Alraya

Datawiz BI helps our chain to conduct in-depth sales analysis. We regularly use reports on sales of stores, categories and products, analyze promotions and stocks. The service provides insights into sudden changes in demand and helps us easily identify unexpected sales leaders. Thanks to BI, we save time and money by optimizing purchases, reducing write-offs, and creating effective promotional strategies. Fast creation of analytical reports allows us to make informed decisions in a timely manner. It is an ideal tool for business growth and development of effective strategies.
Category manager at Express24

We use the BI service to analyze sales in our chain - reports by store and category, sales comparisons, and convenient dashboards have become indispensable in our work. Thanks to comparative analytics, we can quickly identify the strengths and weaknesses of the assortment, and controlling stocks allows us to avoid shortages or overstocks. This is a tool that really helps us make important decisions based on analytical insights.
Supply Manager at ROST supermarket chain
 No credit card required