Business Intelligence
BI tool for retail chains
Make daily decisions using smart data!
BI system includes more than 60 analytical reports for all retail chain processes
The service allows you to create custom dashboards and visualizations based on the received data. The main goal of BI software is to simplify the process of analyzing all key facts in real-time and track changes that can influence the chain and its effectiveness
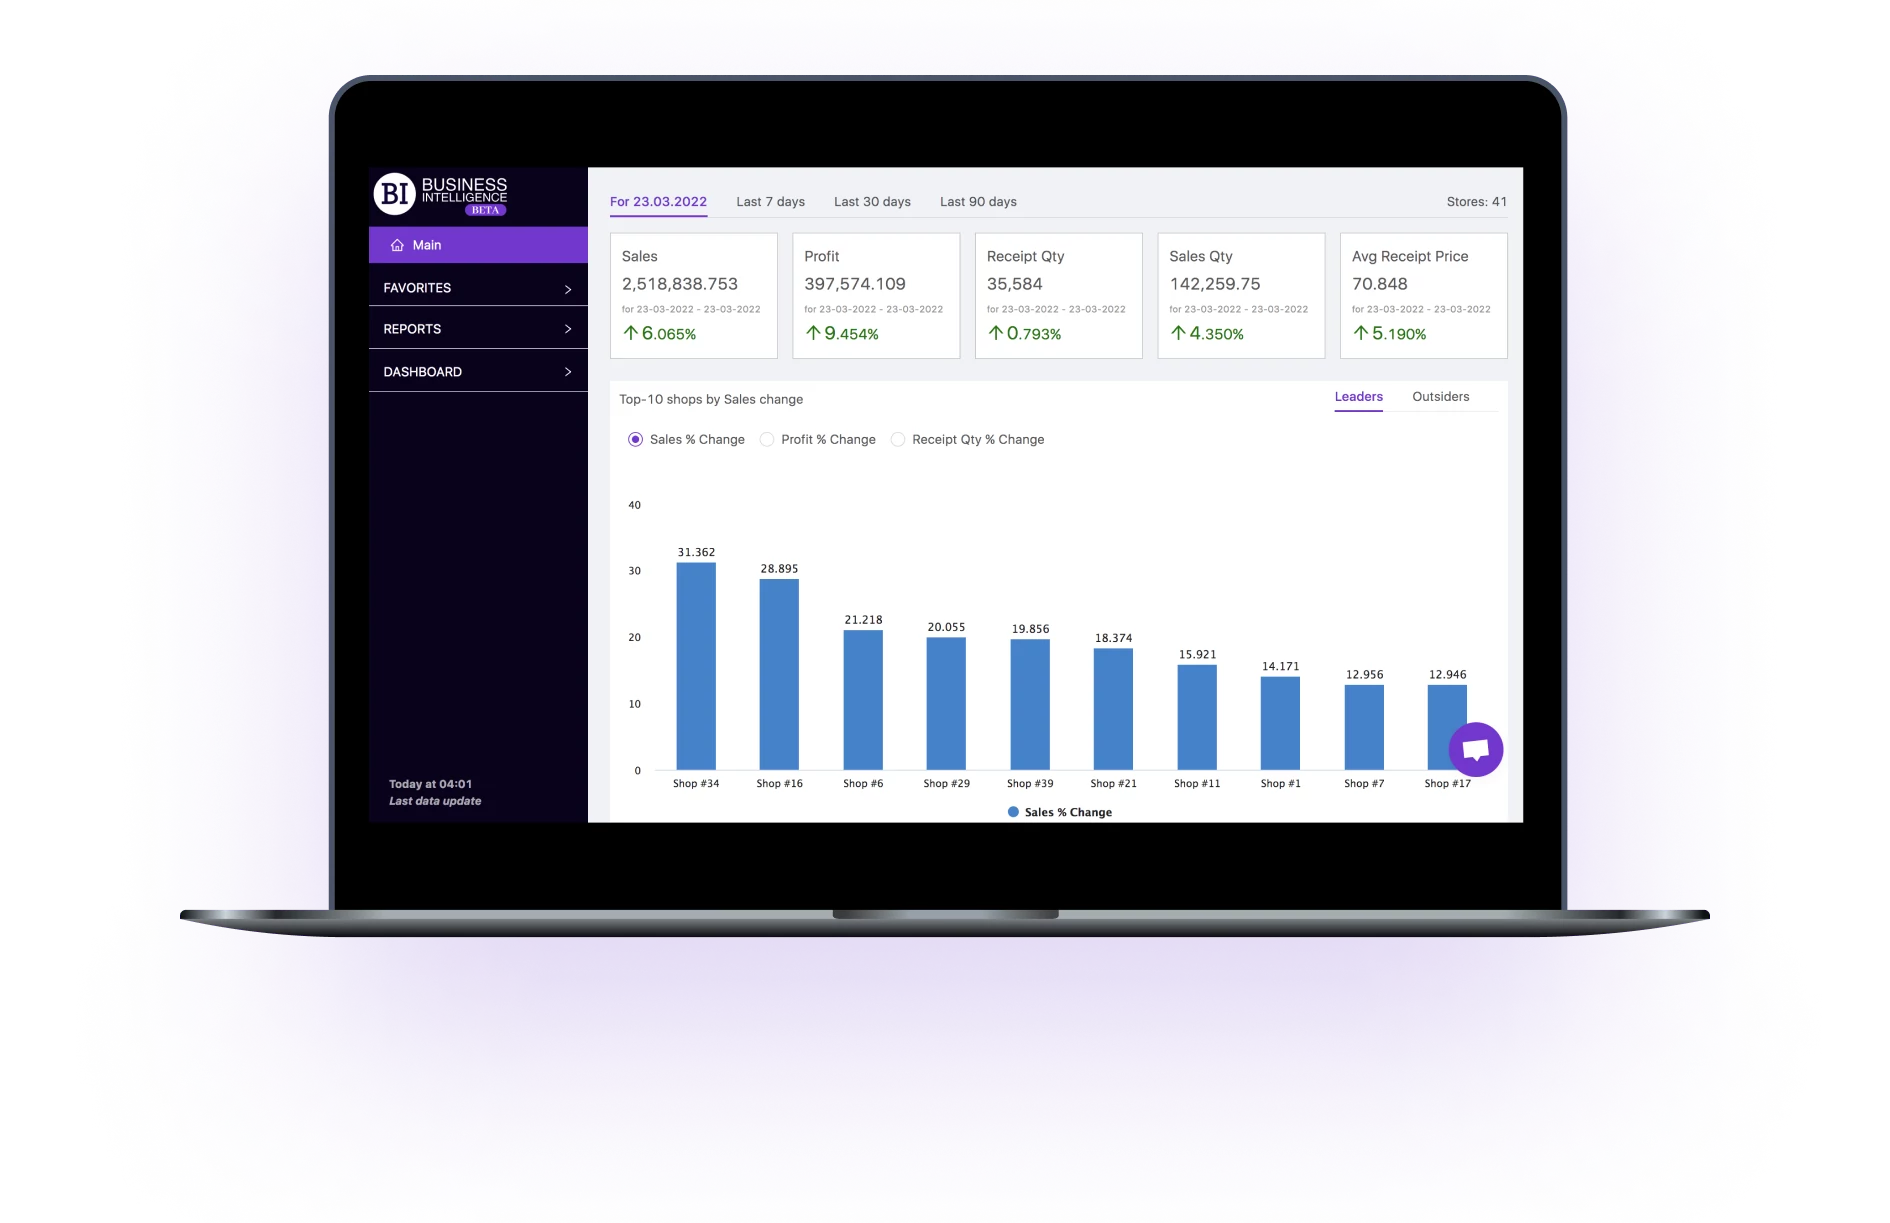
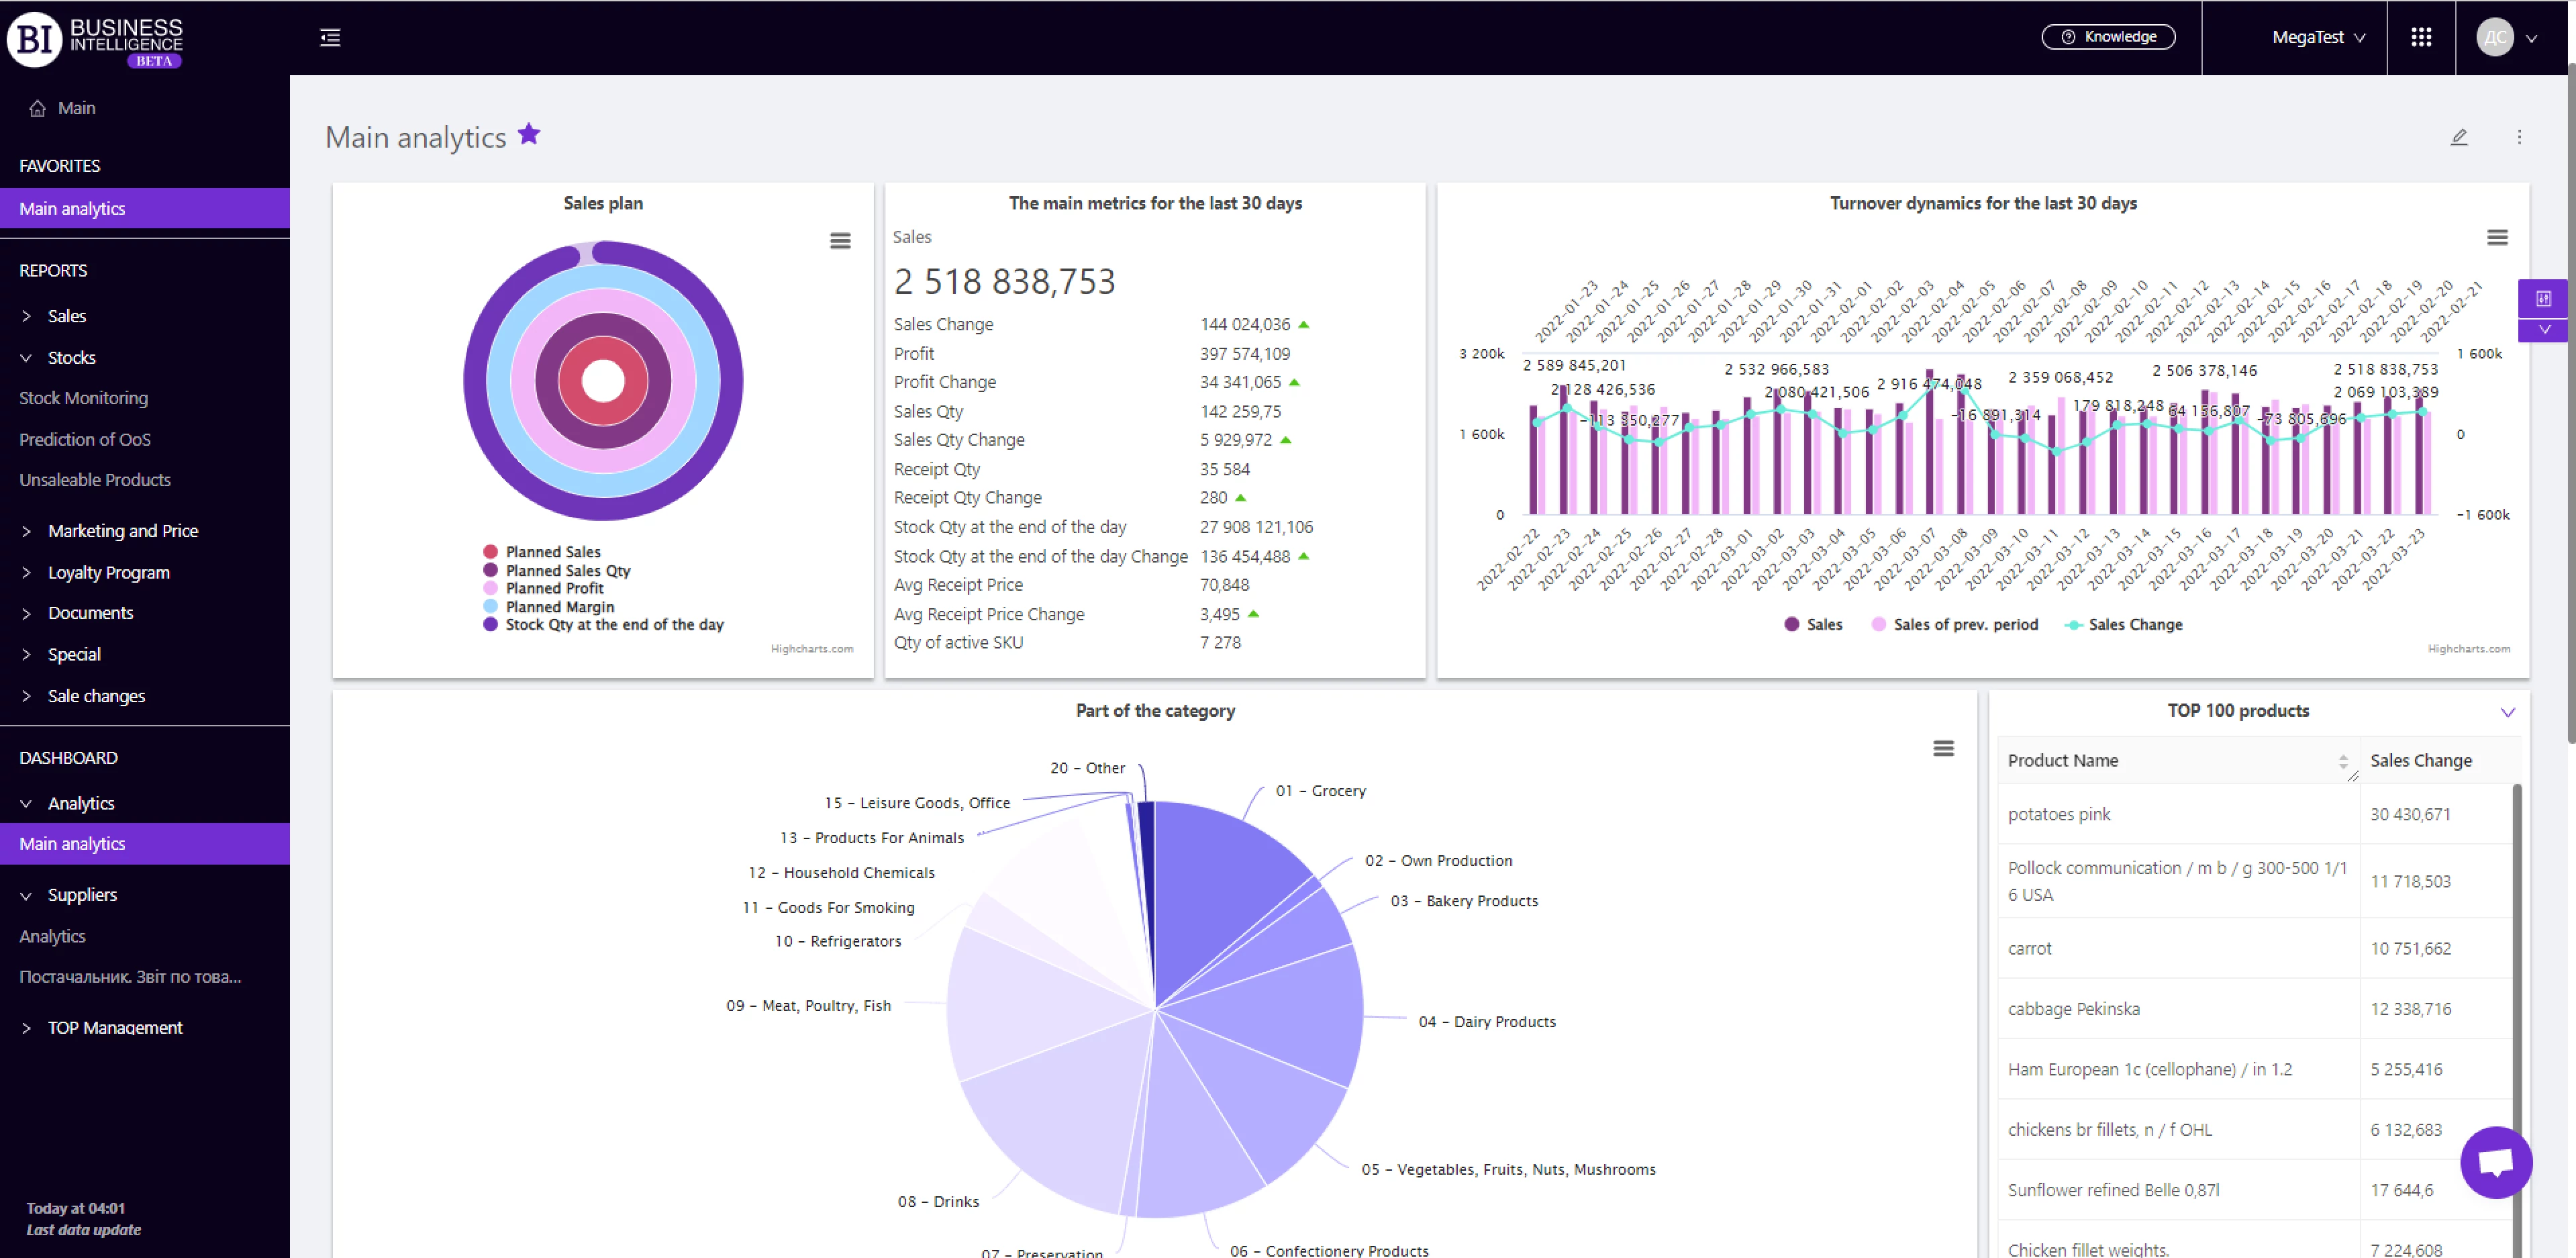
The reporting of the BI service allows you to track sales dynamics ( stocks, lost sales, prediction of OOS, overstocks, products for adjustment). And analyze the effectiveness of the assortment, marketing campaigns and reliability of suppliers
Unique algorithms provide insights from the data, reduce the time for analysis and save it on making important decisions
BI Service Features
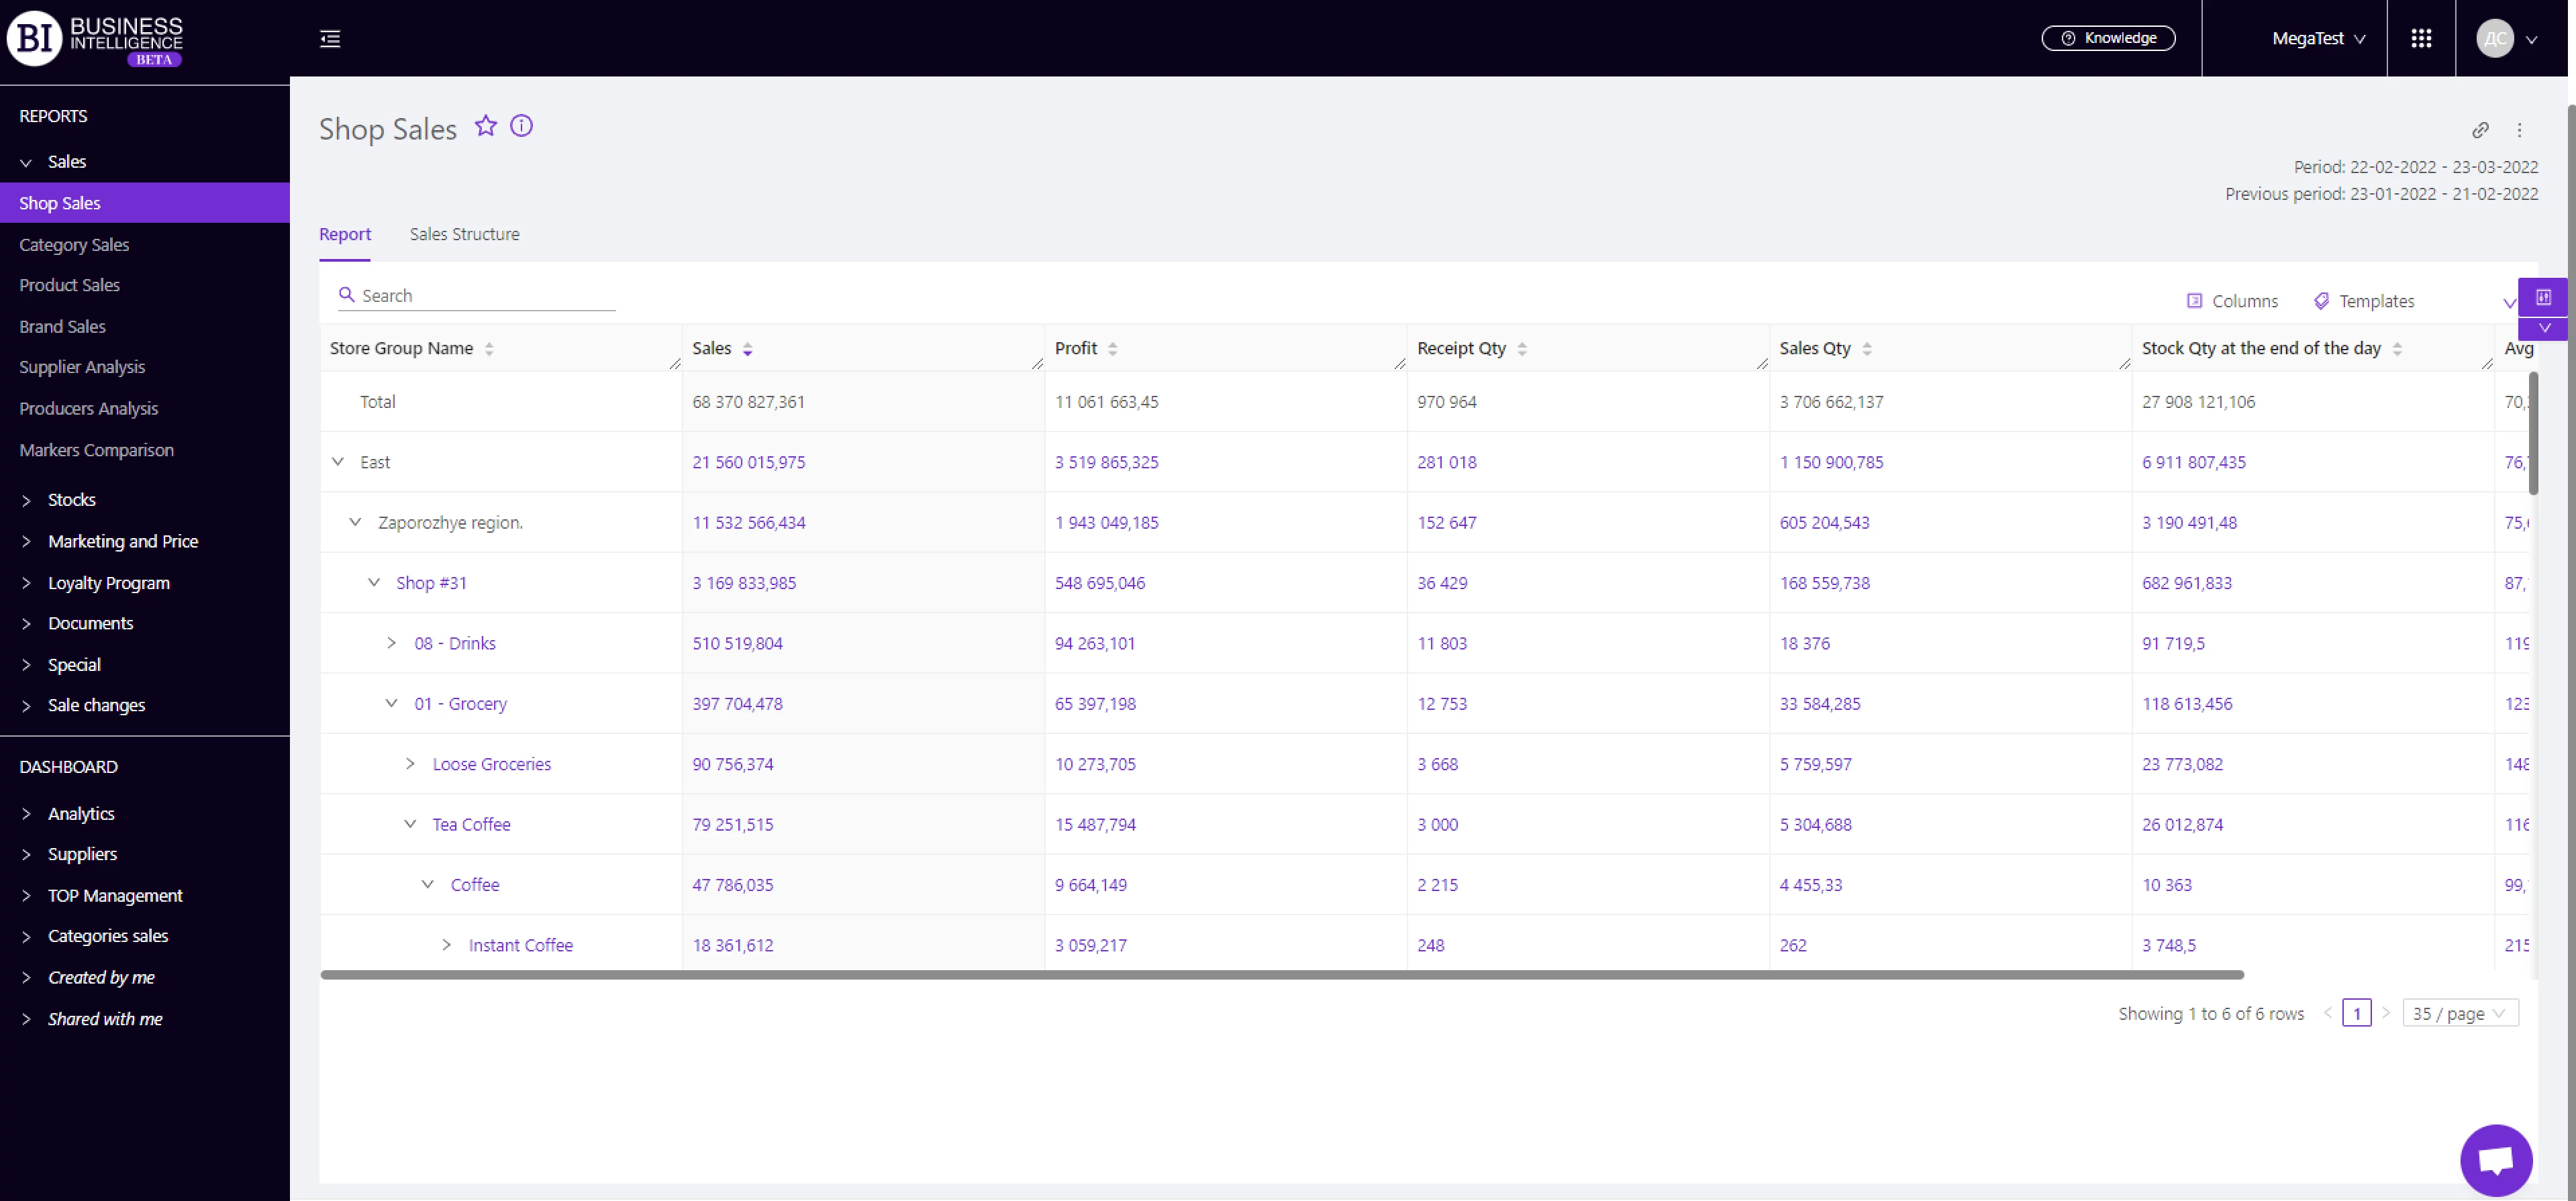
In-store sales analysis
The ability to evaluate all the main facts for each product and category in terms of the store, region or the entire retail chain. BI reporting helps to analyze the drawdown in sales, comparing year to year, month to month, day to day. The service includes tools for quickly finding the reasons for negative or positive dynamics at all levels, from stores up to categories, brands and SKUs
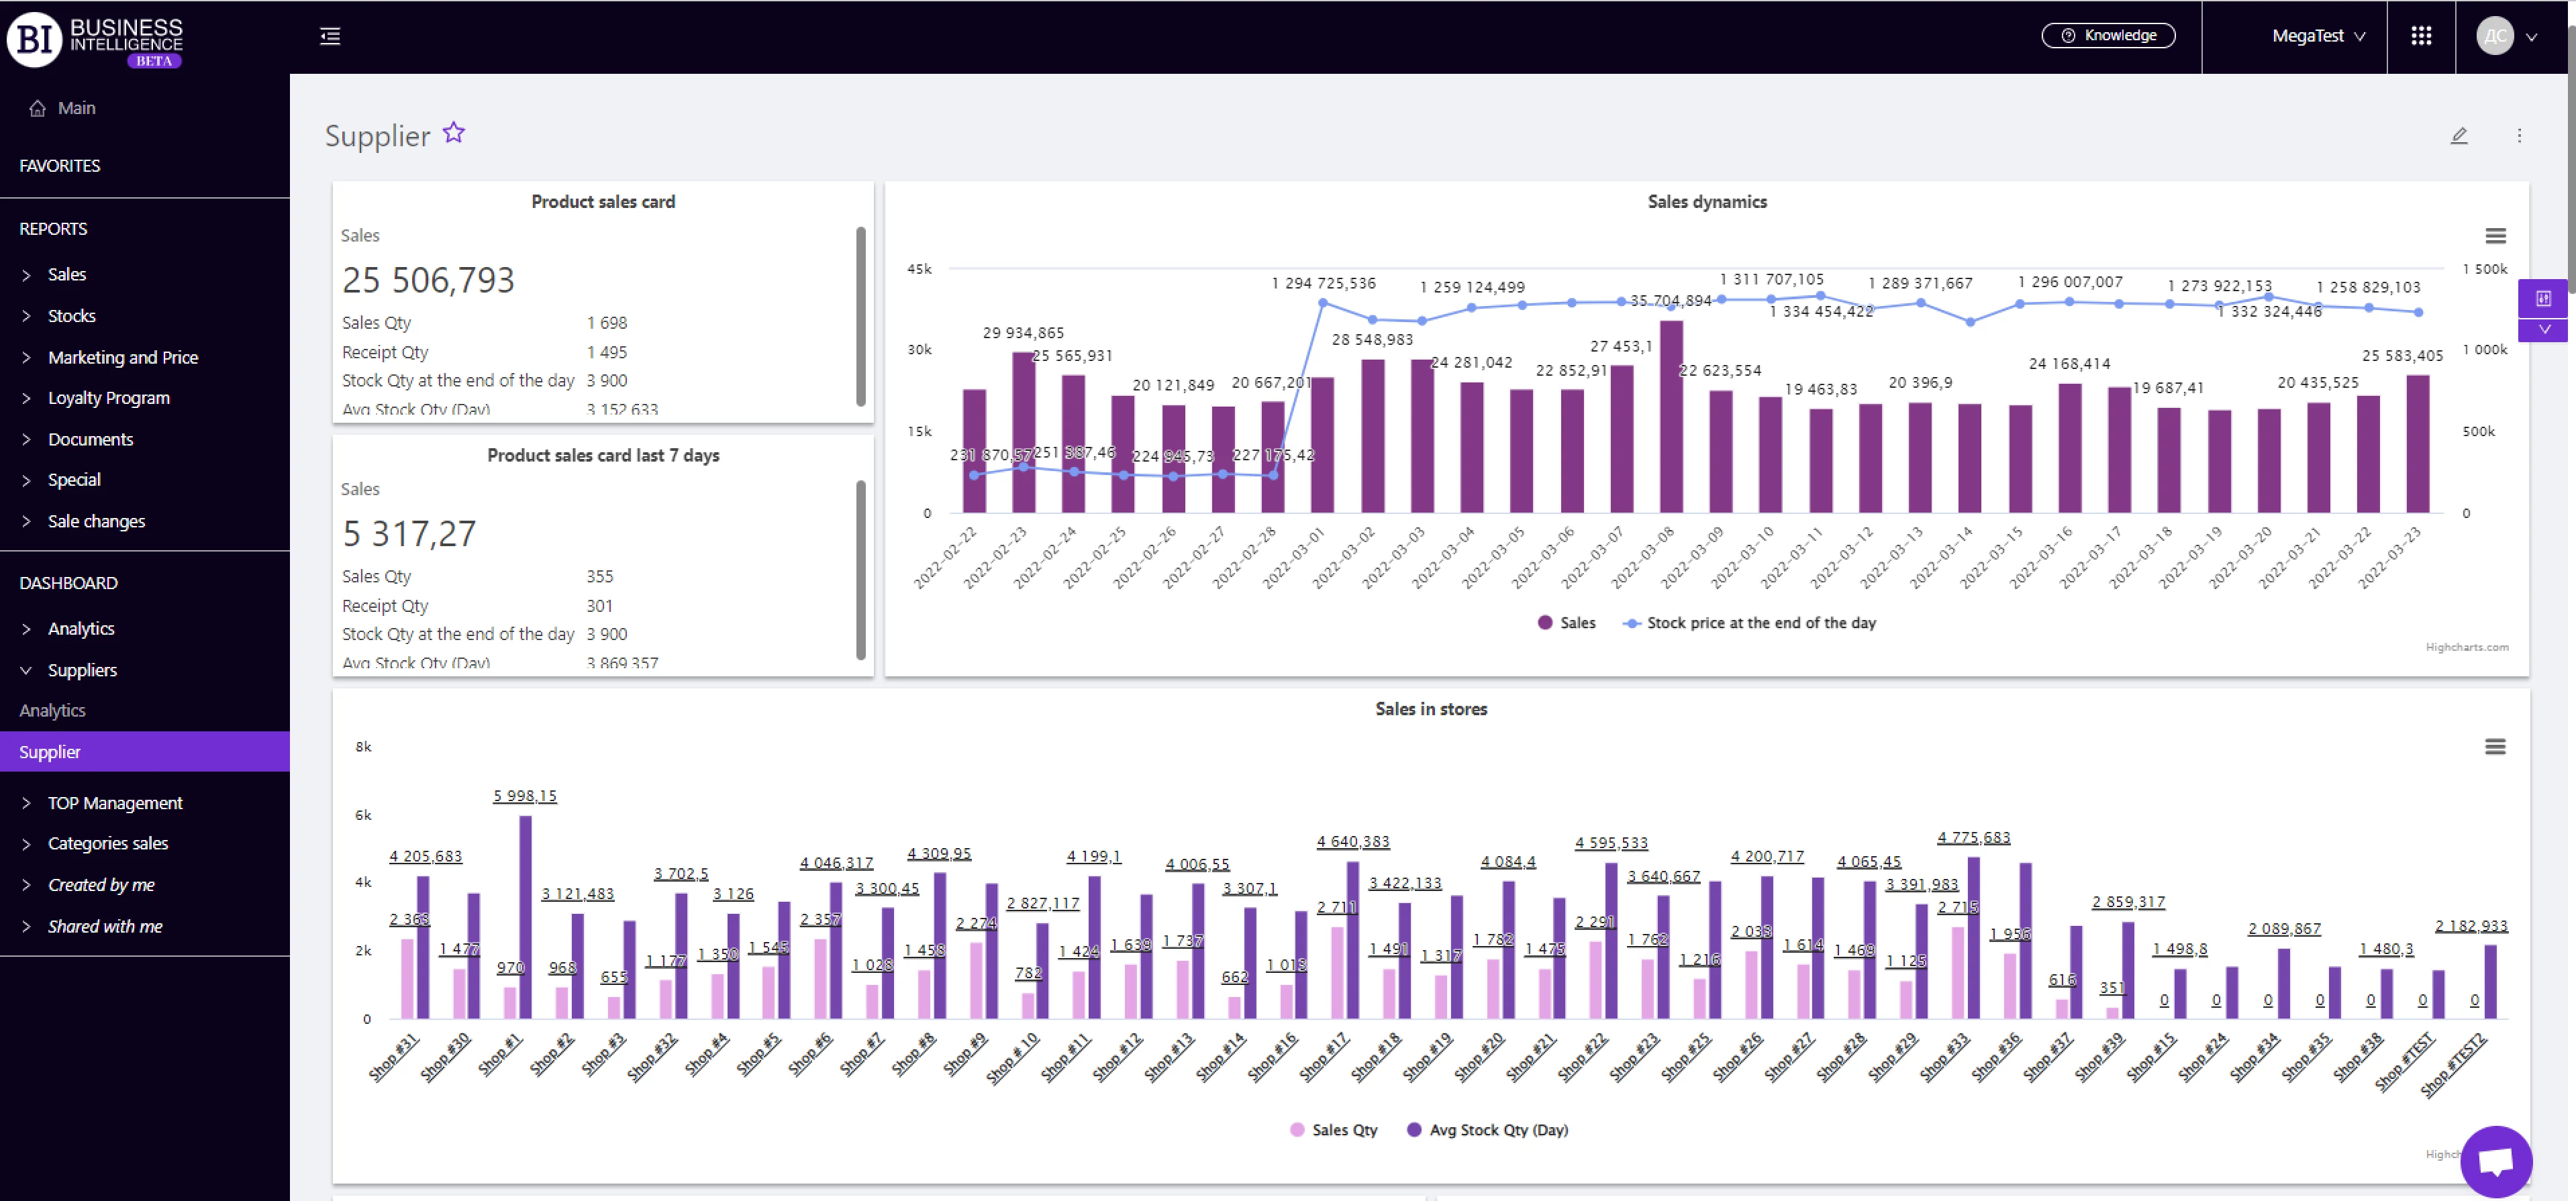
Supplier reliability assessment
Analytics of key facts and consolidated reporting on all chain suppliers give the strongest advantage in the negotiation process. BI reports allow you to analyze the stability of deliveries, order sizes, the number of stocks, returns or losses due to short deliveries. This information allows you to evaluate the feasibility of cooperation with each supplier and change agreements, if necessary taking into account all the key financial facts - post payment terms, cost of capital, GMROI
Stock control and optimization
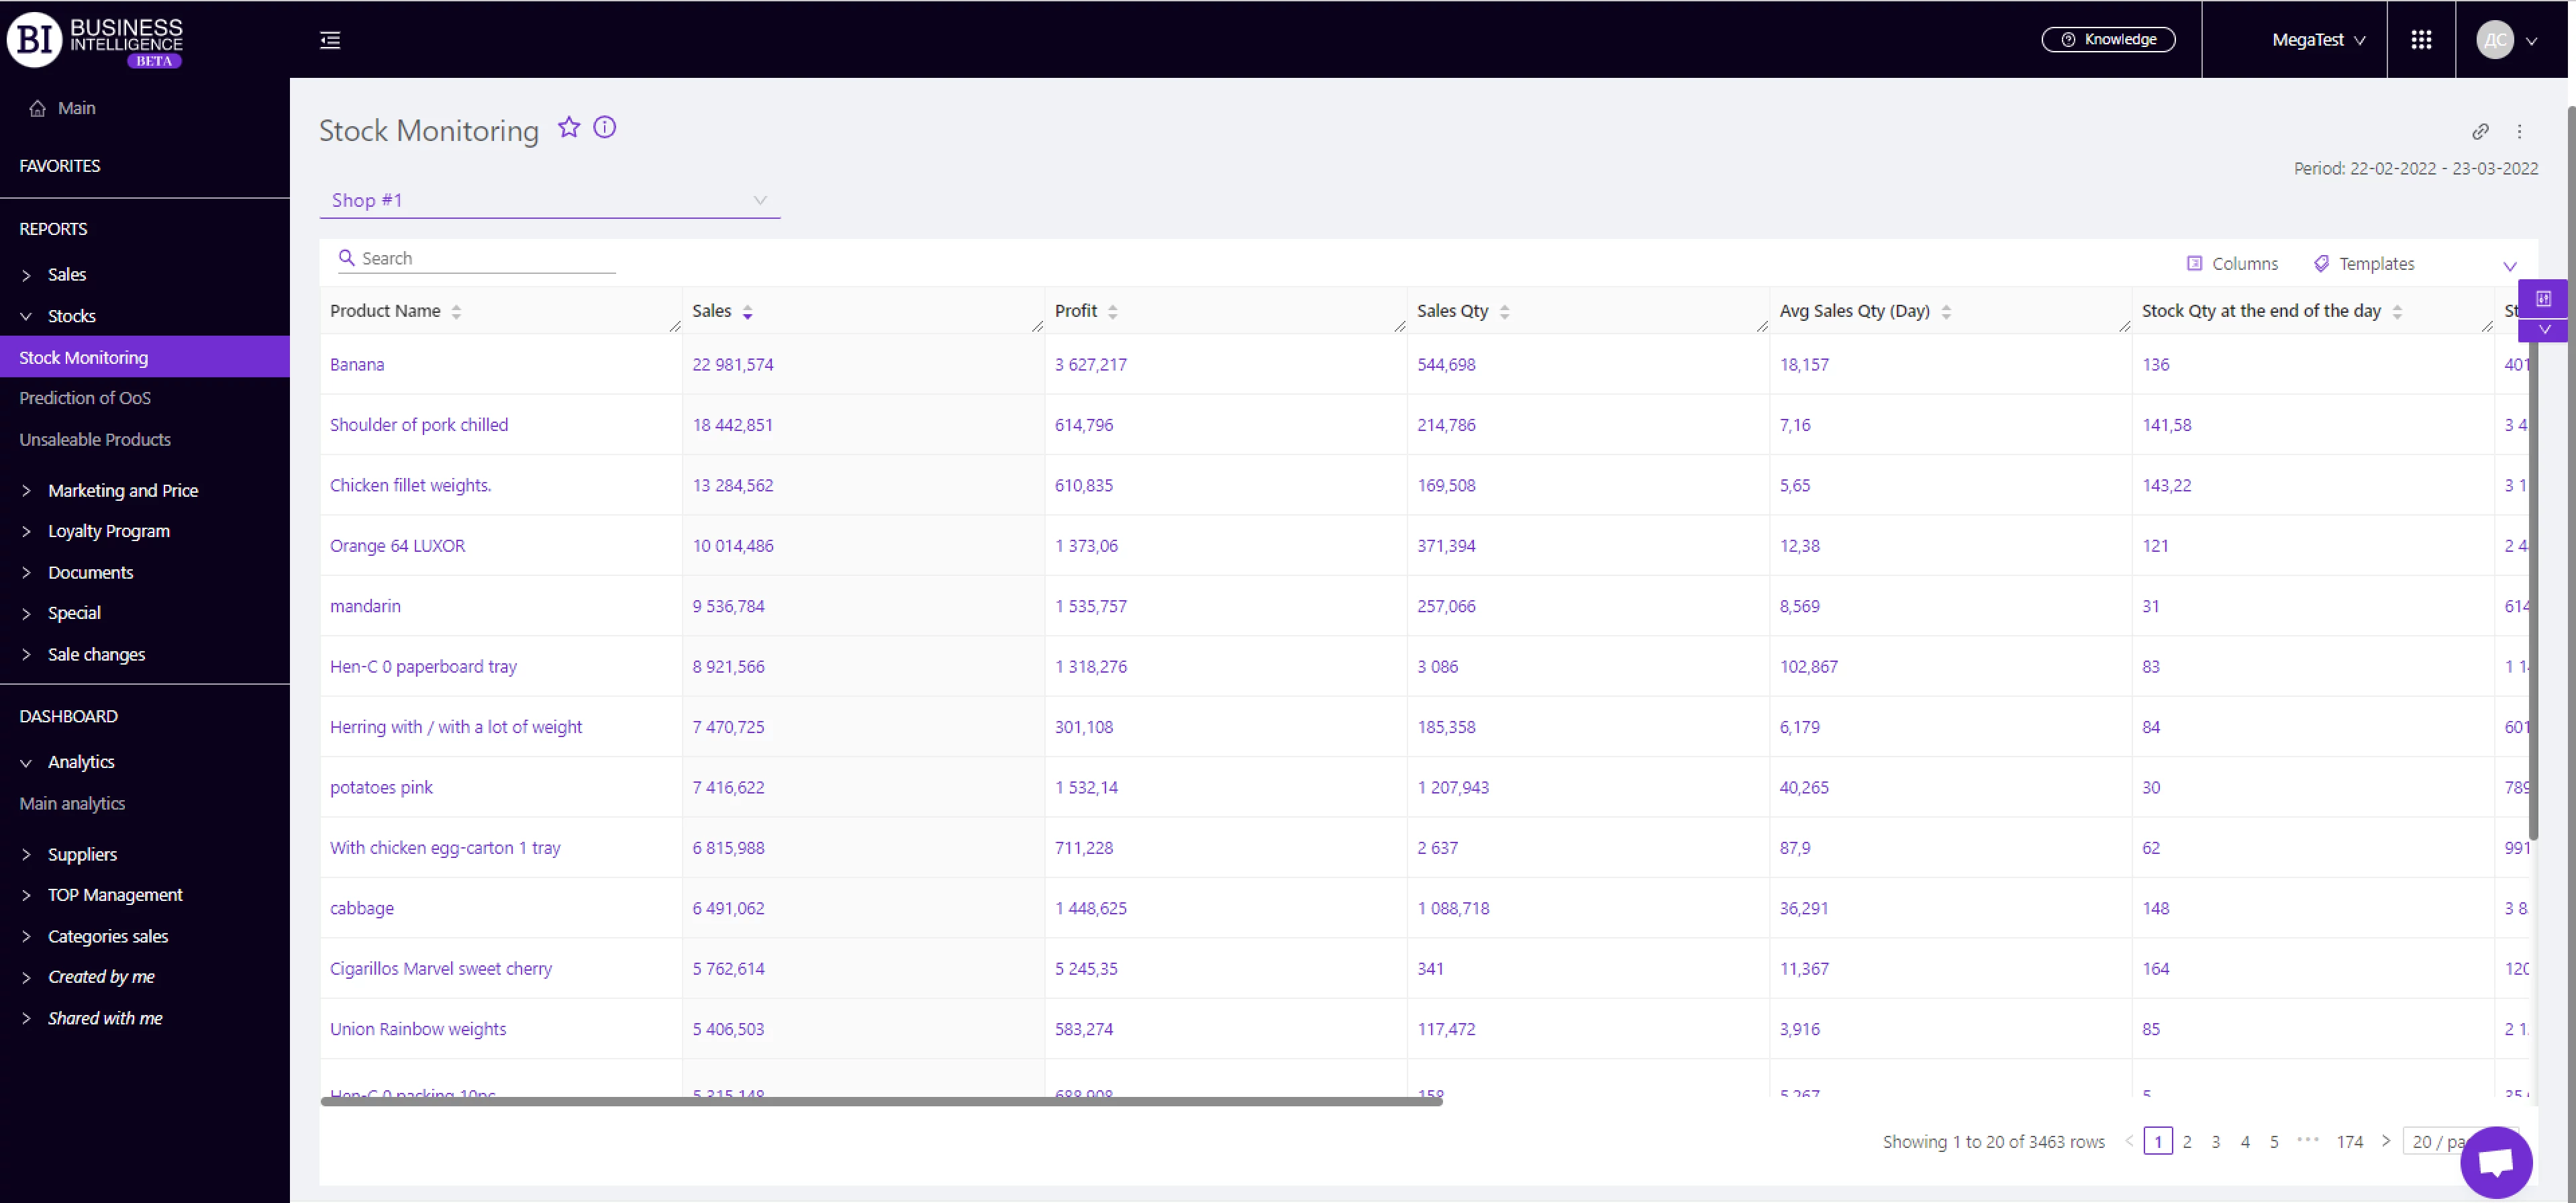
The reporting of the service allows you to see your lost sales, overstocks, products for adjustment to predict out-of-stock at each store. This allows you to correctly form an order for each supplier. BI reports will support you to take into account the turnover of each product and the current stock at all stores. The order based on this data will help to avoid product gaps and reduce sales losses from OOS (13%), overstocks (15%), products for adjustment (in average 700+ SKUs per month)
Assortment optimization
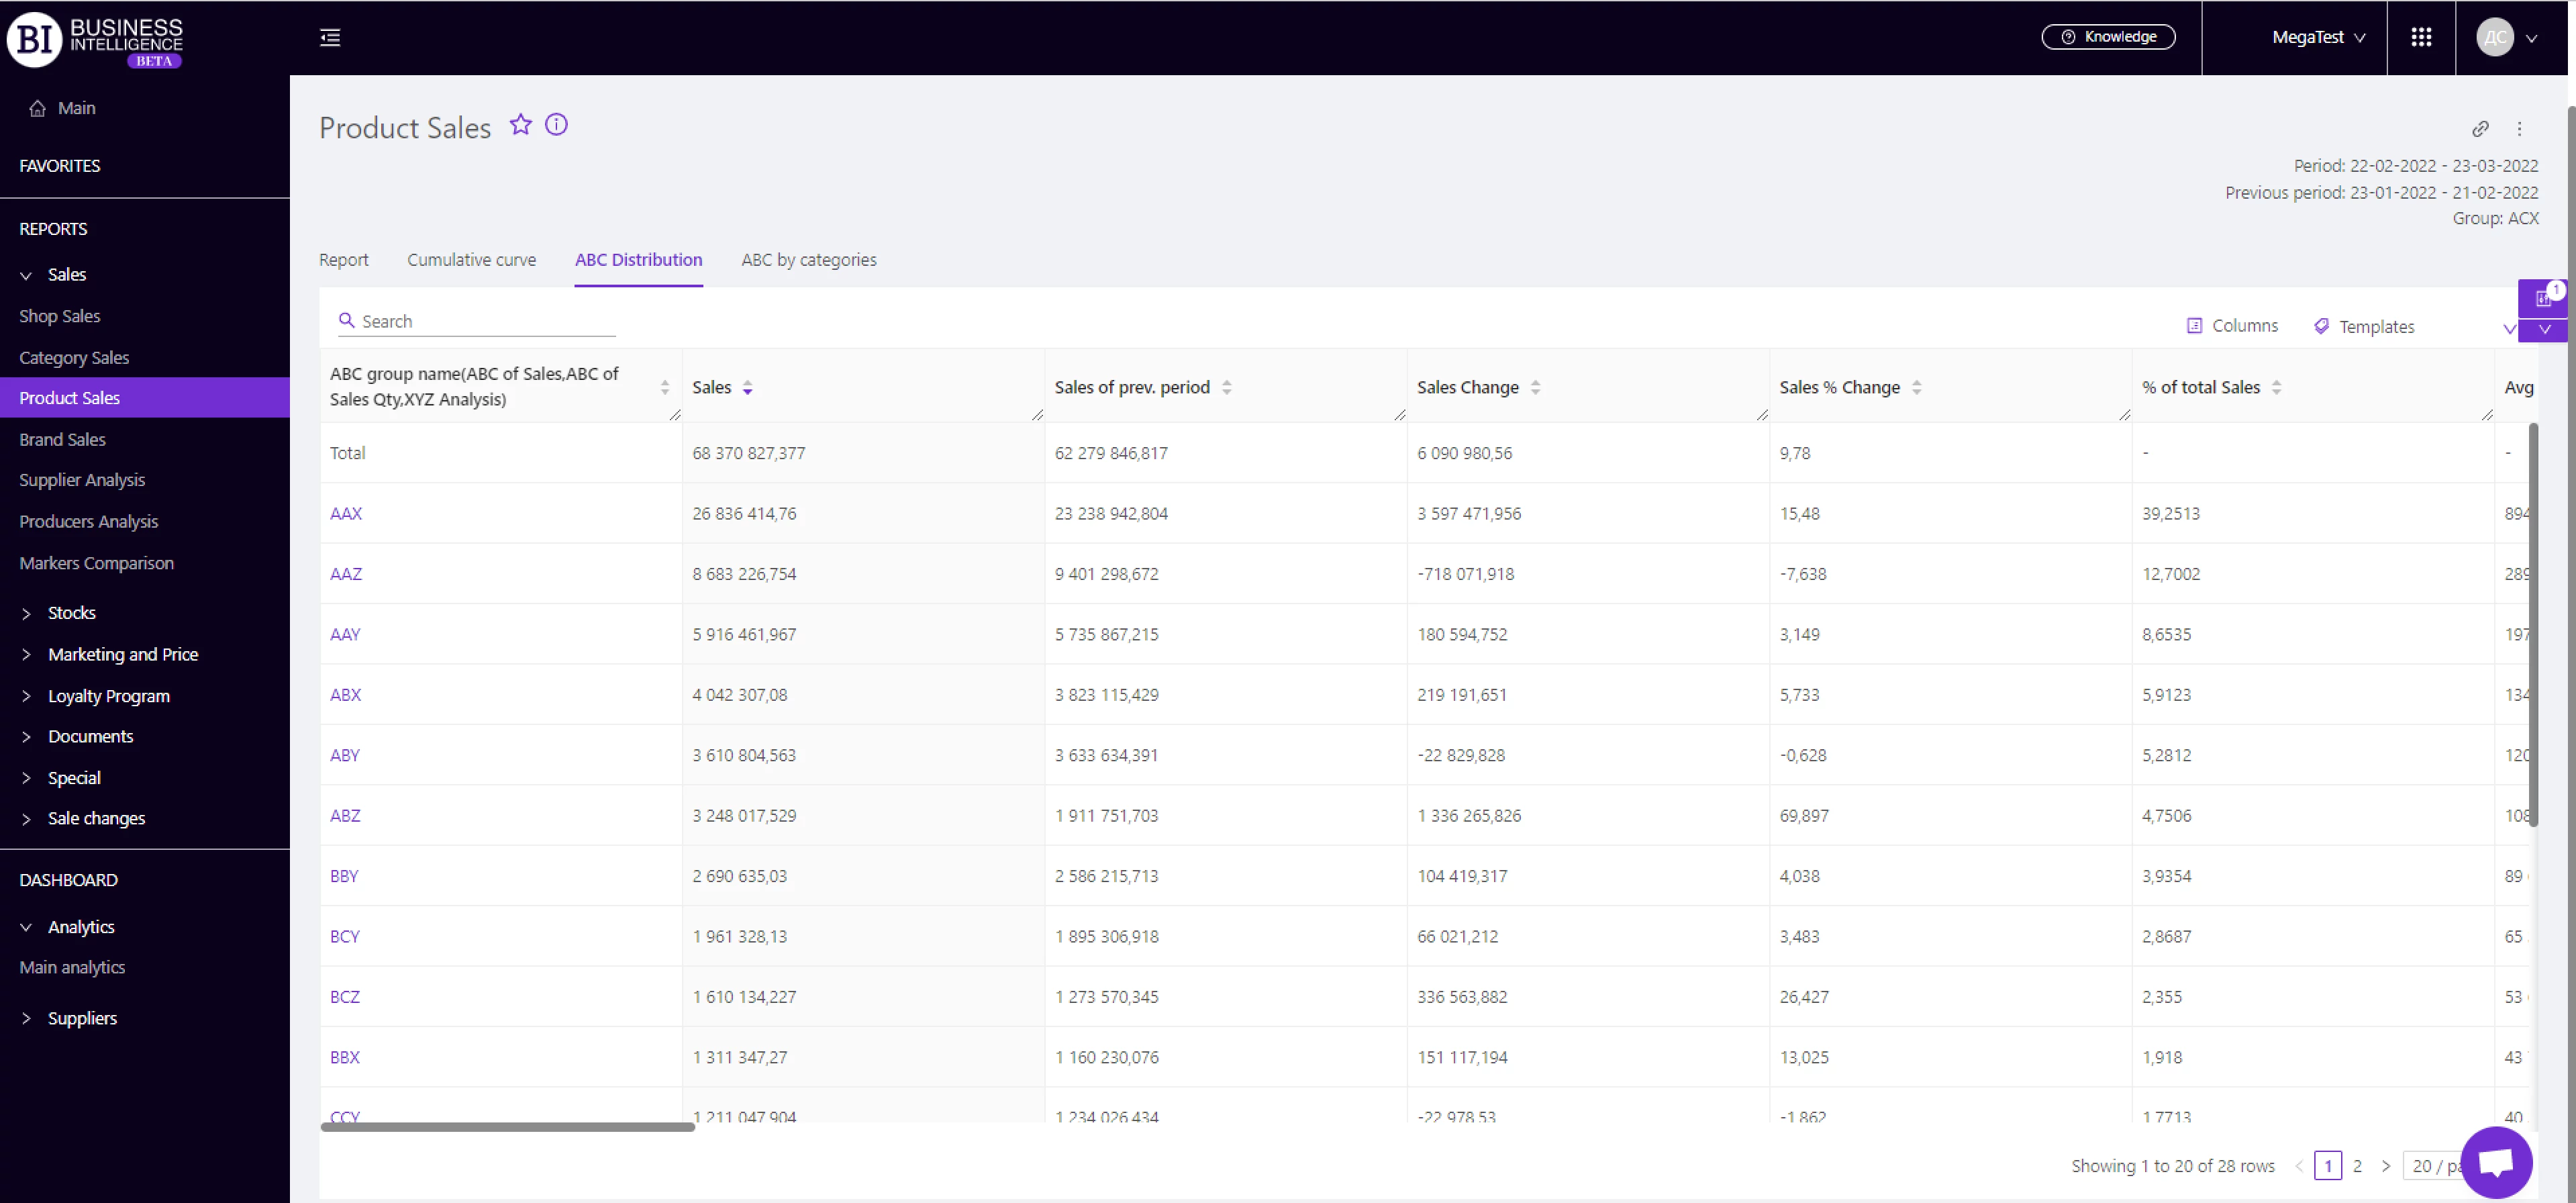
The BI service allows you to conduct a comprehensive analysis of each product group, identify problematic products and give recommendations for adjusting the assortment. This is the main Business Intelligence tool for working with optimization, which allows not only to make changes to the assortment but also to evaluate the effectiveness of decision-making with the powerful ABC, XYZ analysis using customized Pareto principle
Loyalty program effectiveness
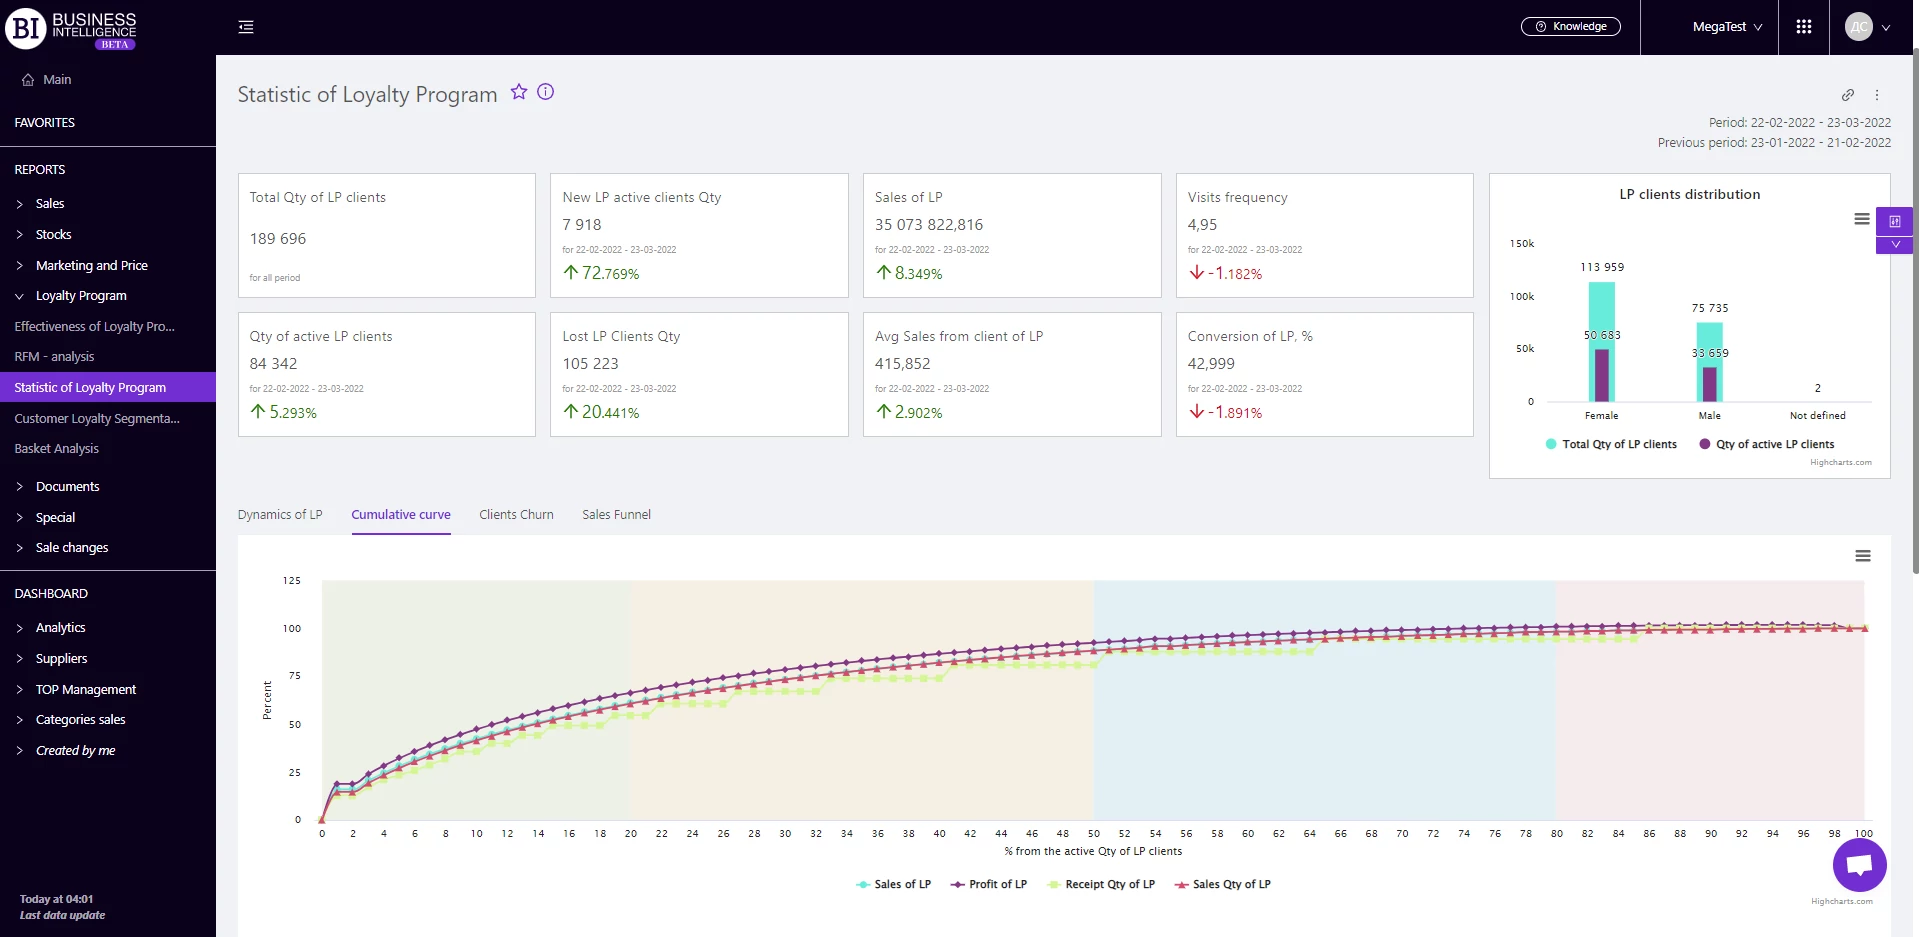
Part of the BI service reporting is aimed at working with the customer base of the loyalty program. It allows you to segment the base, identify key or problem customers, identify the abnormal customers, make RFM, сohort analysis and сlient сhurn report to take strategic and tactical decisions. Consumer basket analysis provides the basis for building your unique selling proposition and the ability to target that proposition to the relevant customer segment
 What's new?
 No credit card required