 What's new?
Retail sales analytics reports
Retail sales data is only valuable when it drives decisions. With advanced retail sales analytics and sales reporting, retail teams can quickly identify underperforming locations, low-margin products, or emerging trends — and respond proactively.
Detailed reports on sales for clearer KPIs and better planning

Time Efficiency
Compared to spreadsheets, structured sales reports significantly reduce the time spent on manual data preparation. All calculations and views are already in place — ready for analysis and decision-making.

Insights at Every Level
Sales data is available by store, category, brand, and SKU — with the necessary breakdowns and structure. Analysts can immediately access the performance of any segment without building reports from scratch.

Decisions Backed by Data
Up-to-date retail sales data ensures that decisions are based on facts, not assumptions. This makes it easier for managers to explain and justify their actions to both colleagues and stakeholders

Understanding Sales KPI Gaps
Did we miss the sales plan — and why? These questions become easier to answer when the data is transparent. Zoom in on weak spots, spot missed opportunities, and turn uncertainty into action.

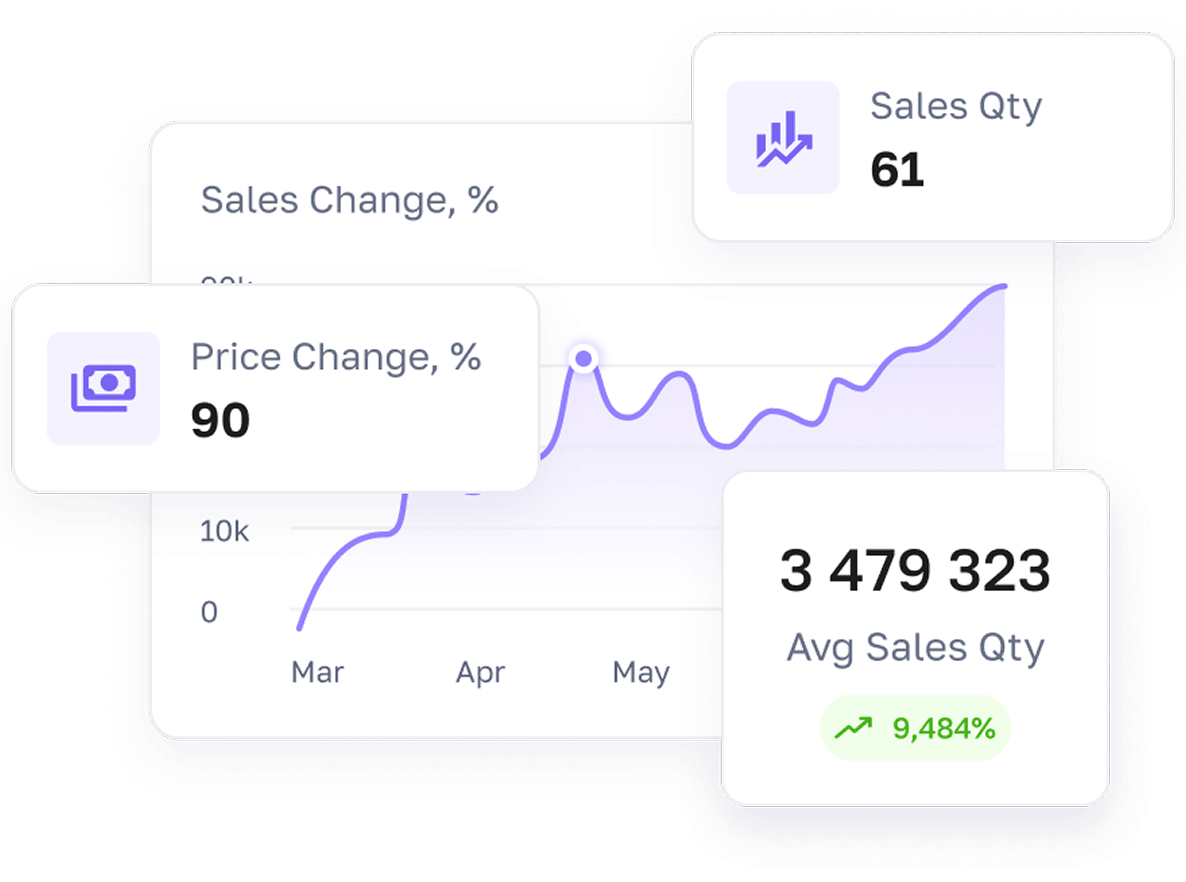
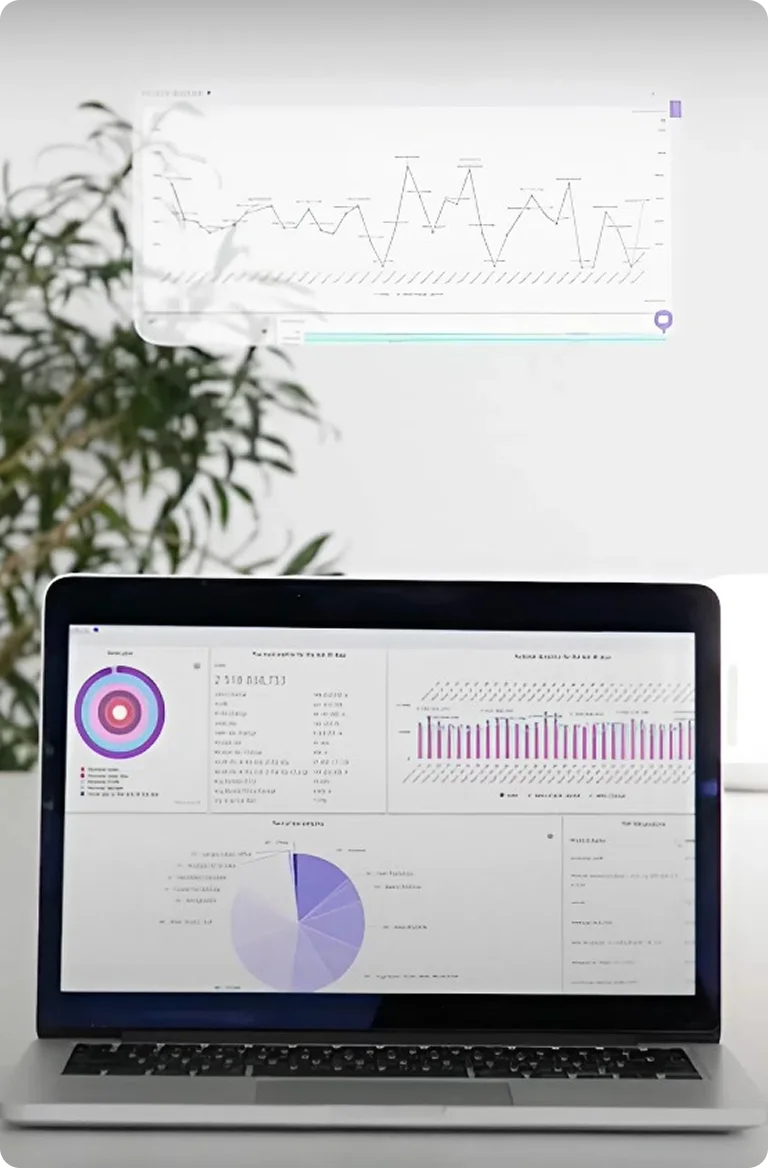
Sales data visualization
Dashboards update automatically and clearly show key retail sales performance. All necessary information is centralized within one system — no need to switch between tools or wait for manual updates.

Improved procurement planning
With descriptive and diagnostic analytics, purchasing decisions become more informed. Seasonal fluctuations and sudden demand changes can be predicted and accounted for, reducing risk and overstock.
Retail data analytics in action: selected report examples
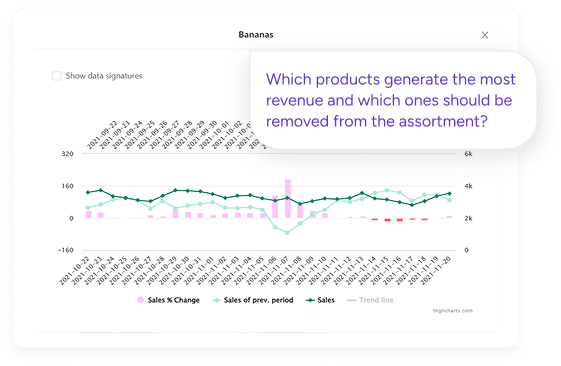
Product Sales Report
This report provides a structured view of product-level retail sales, supporting assortment analysis with ABC and XYZ classification. It helps category managers evaluate each SKU’s contribution and make data-driven assortment decisions.
Key capabilities:- Identify top-performing and underperforming items for targeted assortment optimization
- Analyze profitability, turnover rate, and sales velocity at the SKU level
- Visualize key sales metrics across the assortment using cumulative curves (Pareto principle)
- Run ABC analysis based on revenue, profit, number of receipts, or quantity sold
Category Sales Report
This report evaluates key sales metrics across all retail categories, helping managers analyze performance from top-level groups to individual SKUs and adjust the assortment based on real business contribution.
Key capabilities:- Compare category-level sales metrics across two periods to monitor dynamics over time
- Visualize sales trends and contributions for each category using comparative charts
- Assess the proportional share of sales and inventory by category to identify imbalances
- Align stock levels with actual sales performance by comparing turnover with inventory volume and value
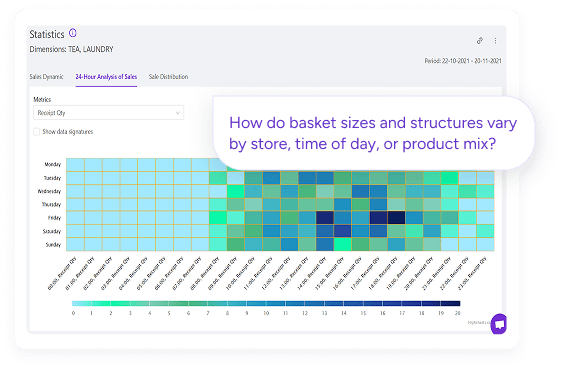
Basket Analysis Report
This report identifies shopping basket patterns across times and scenarios, revealing how customers combine products and helping managers make informed merchandising and marketing decisions.
Key capabilities:- Detect which categories or products are most often purchased together during specific timeframes (e.g. by hour or day of week)
- Uncover customer purchasing patterns based on basket size, value, or composition
- Support in-store merchandising strategies by aligning product placement with real buying habits
- Build more targeted marketing campaigns using behavior-based segmentation
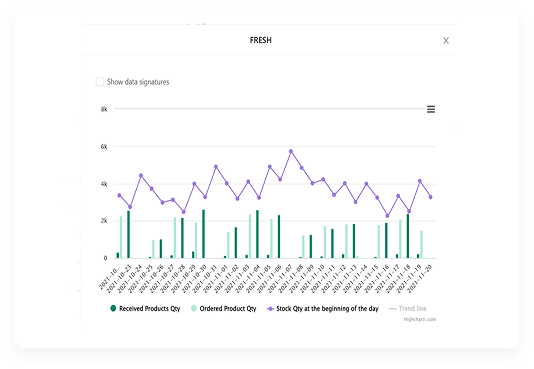
Lost Sales Report
This report identifies missed sales opportunities caused by zero or insufficient stock levels across products, categories, stores, and category managers. It helps uncover the financial impact of poor stock availability and reveals patterns that lead to lost revenue.
Key capabilities:- Detect products and categories with frequent sales losses due to stockouts or low availability
- Quantify lost revenue and units based on demand vs. stock levels
- Visualize stock and sales trends to identify recurring challenge areas
- Understand root causes behind missed sales — from delayed deliveries to understocked items
Business-critical issues resolved with retail data analytics
- Solved with:
Basket Analysis report
Reveals typical basket combinations by time and product, with clear visualizations and customizable templates for easy regular review.
- Solved with:
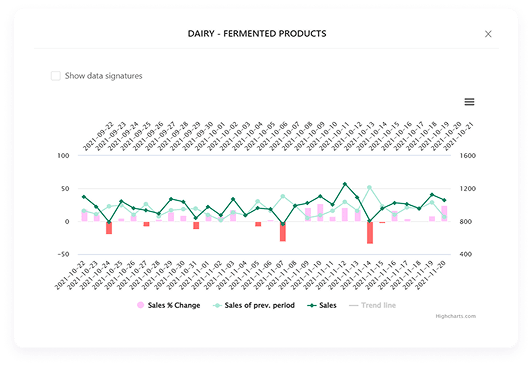
Sales Dynamics report
Sales Dynamics report — enables retail sales analysis by comparing key metrics across periods with interactive charts and saved templates for ongoing monitoring.
- Solved with:
Product Sales report
Product Sales report — segments products by profitability and sales stability (ABC/XYZ), providing visual hierarchy and flexible views for efficient focus.
- Solved with:
Category Sales report
Category Sales report — breaks down sales KPIs by category level, offers visual comparisons and stock-to-sales analysis, all in customizable formats.
- Solved with:
Lost Sales report
Lost Sales report — quantifies lost revenue linked to inventory gaps, with visual dashboards and monitoring templates to prevent future losses.

Datawiz- a single source of truth for your retail data
All your analytics in one place
From sales and inventory to staff performance — every key metric is centralized. It’s convenient for teams and gives managers full visibility to stay in control and react fast.
Accurate forecasting based on real data
Descriptive analytics help you plan ahead with confidence. Instead of relying on assumptions, you forecast using customer behavior, seasonality, and actual sales trends.
Local-level control for stores
Datawiz lets you break down performance by store, category, or manager. Spot problems early, address local issues fast, and support your regional teams with actionable insights.
Intuitive system — no tech skills required
With a user-friendly interface, built-in tips, and live chat support, your team can get started instantly. No analysts needed and no delays. Just fast onboarding and immediate value.
Q&A
With Datawiz.io, retailers can analyze sales by baskets, products (ABC/XYZ), categories, and stores. Reports highlight sales dynamics and lost sales, helping managers detect trends, inefficiencies, and growth opportunities.
A sales report typically covers sales volumes, revenue, margins, and dynamics across products, categories, and stores. Datawiz.io reports also track lost sales and customer basket structure for deeper insights.
Advanced analytics provides ready-to-use reports, interactive dashboards, and real-time updates. Unlike spreadsheets, Datawiz.io helps detect sales changes instantly, monitor store/category performance, and reduce manual errors.
Retailers can track revenue, margin, sales growth, lost sales, product turnover (ABC/XYZ), basket value, and store/category performance. Datawiz.io visualizes these KPIs to support faster and more accurate decisions.