 What's new?

Data visualization is a graphical representation of a data set to facilitate the perception of information.
Tabular format is useful for historical data storage and reporting. Structured information is easy to update, change variables and keep current. When analyzing, tables allow you to quickly sort data, compare metrics, and perform calculations.
However, without data visualization, it is very difficult to see significant outliers or new sales trends.
Why is data visualization important?
- Easy to understand and share
Data needs to be understandable not only for auditors or professionals who work with data on a daily basis, but also for the end audience. If a company wants to adapt quickly to market changes, the speed of information delivery and diving into the context of the problem determines the level of competitiveness. Data visualization conveys key points to different teams without the need for technical expertise. The human brain is cognitively tuned to process visual elements. Audiences process images and graphics many times faster than text or numerical data. That's why quality visualization is not just a “pretty picture” but a tool for team understanding and quick decisions.
- Informed decision making
Visualizations turn complex data sets into easy-to-understand visual elements. This allows decision makers to quickly analyze key information without delving into detailed reports. Visualizations provide an opportunity to deliver a clear message or show a comparison of seasons to improve decisions in the future. And when decisions are based on clearly presented data - both confidence and results grow.
- Objective view of the real state of the business
Data visualization prevents you from missing strange trends or changes in the market. This tool helps managers to bring all the data together, build connections between numbers. Experts can easily prioritize the direction of their efforts based on the analysis of the dynamics of indicators. Identifying correlations and cause-and-effect relationships help build hypotheses and improve tactical actions.
- Comparing two or more indicators
Many types of visualizations are designed specifically to display multiple indicators simultaneously on a single graph or chart. This makes it easy for a regional manager to compare the performance of two stores in different locations and choose a unique solution for each. Comparing performance over time is another additional benefit of charting. Such data will show a more probable picture taking into account seasonality or peak dates.
Principles of Building Data Visualization
Since data visualization is a really important tool for any business, you need to be able to build it with the right connections and data. It should be clear, informative and attractive. Data visualization principles are a mixture of analytics, design and color perception psychology.
Here's a list of data visualization principles:
- Clear goal.
It is necessary to understand what exactly you want to show on the visualization: a trend for the quarter, a comparison of two indicators, the relationship of data. It will be easier for the manager to emphasize the main goal. Then it will be clear to the end viewers what to pay attention to and explore.
- Ease of Perception.
A streamlined visualization makes life easier for users. A chart or graph should contain only the necessary elements, without unnecessary colors and with clear captions. This will help users focus their attention on what's important and not get distracted.
- Choosing the right type of visualization.
The incorrect visualization will show the data in the wrong way. We won't get solutions to our problems and we won't be able to analyze anything. That's why lines are better to use for dynamics, columns for comparison, and a pie chart shows percentages.
- Accuracy and logical information.
Data should add up in a logical series, go in the right order, at the right scale. While it's easy to visualize with the latest tools, you shouldn't forget the importance of data accuracy. Even a small error can ruin the entire analysis made.
- Proper use of color.
It is not advisable to use very many shades or similar colors. The contrast of colors should be maintained to separate the data. You also need to consider the subconscious interpretation of colors. Green is associated with improvements and good results, so it should be used with positive results. If the dynamics are on the decline, in which case red is ideal.
Types of Data Visualization
Understanding the types of data visualization helps you choose the format that works best for a particular message - whether it's a trend, a comparison, a structure, or a share. The right choice determines how quickly and accurately the information is perceived. For example, a line graph can instantly show dynamics that a table would simply hide in numbers. A well-chosen type of visualization not only simplifies analysis, but also minimizes the risk of misinterpreting data.
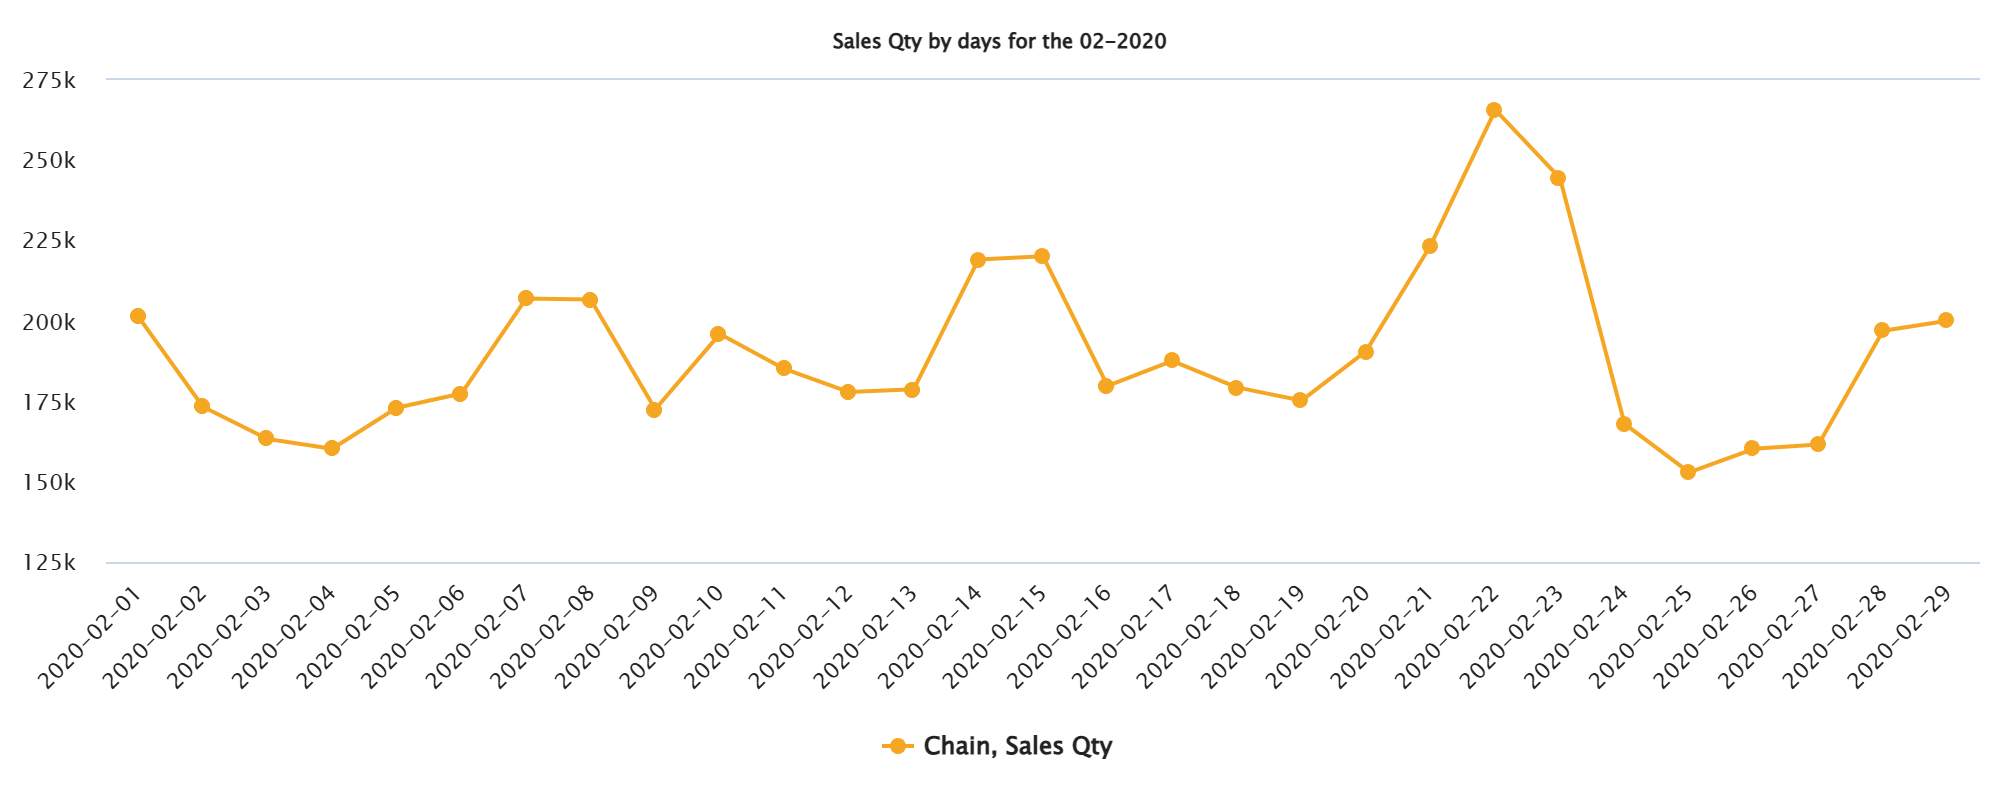
- Line graphs. This type of visualization is ideal for showing changes in metrics over time. It allows you to quickly notice trends, seasonal fluctuations or gradual increases and decreases. Line graphs in retail allow you to track the dynamics of sales, traffic or demand over time - by day, week or season. They clearly show growth, downturns and recurring trends, which helps you make informed decisions.
- Histogram. A histogram allows you to see how often certain values occur within specified ranges. It is useful when you want to evaluate the distribution of data and identify clusters or outliers. A histogram in retail shows how often certain values occur - for example, the number of receipts in different price ranges or the distribution of products by sales level. This helps identify patterns, peaks in demand, or segments with low activity.
- Pie Chart. This visualization shows how the parts relate to the whole. It works best when there are few segments and it is important to emphasize proportions. A pie chart in retail is used to visualize the share of each segment in the total volume, for example, the distribution of sales by product category or channel. It allows you to quickly assess which areas generate the bulk of your revenue.
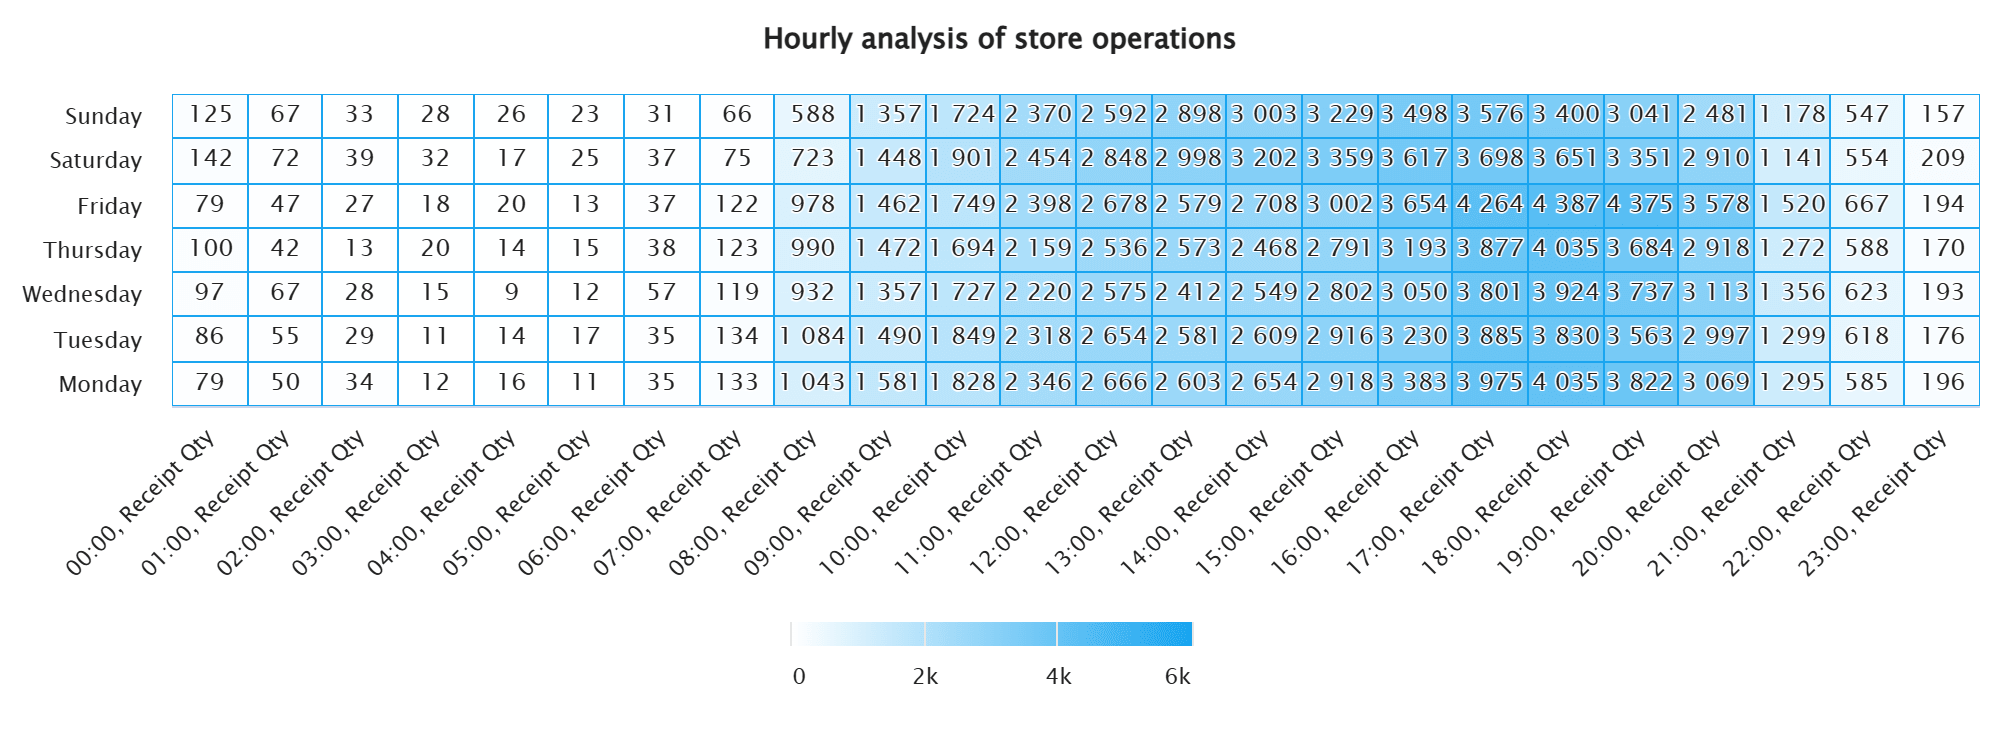
- Heatmap. A heatmap helps you quickly identify patterns in a data set using color. It is ideal for visualizing the intensity of events, activity or ratios in tables. A heatmap in retail helps to visually highlight areas of high and low activity, such as sales by day of the week and hour, or shelf efficiency in a store. Color coding makes it easy to spot peak periods or trouble spots that need attention.
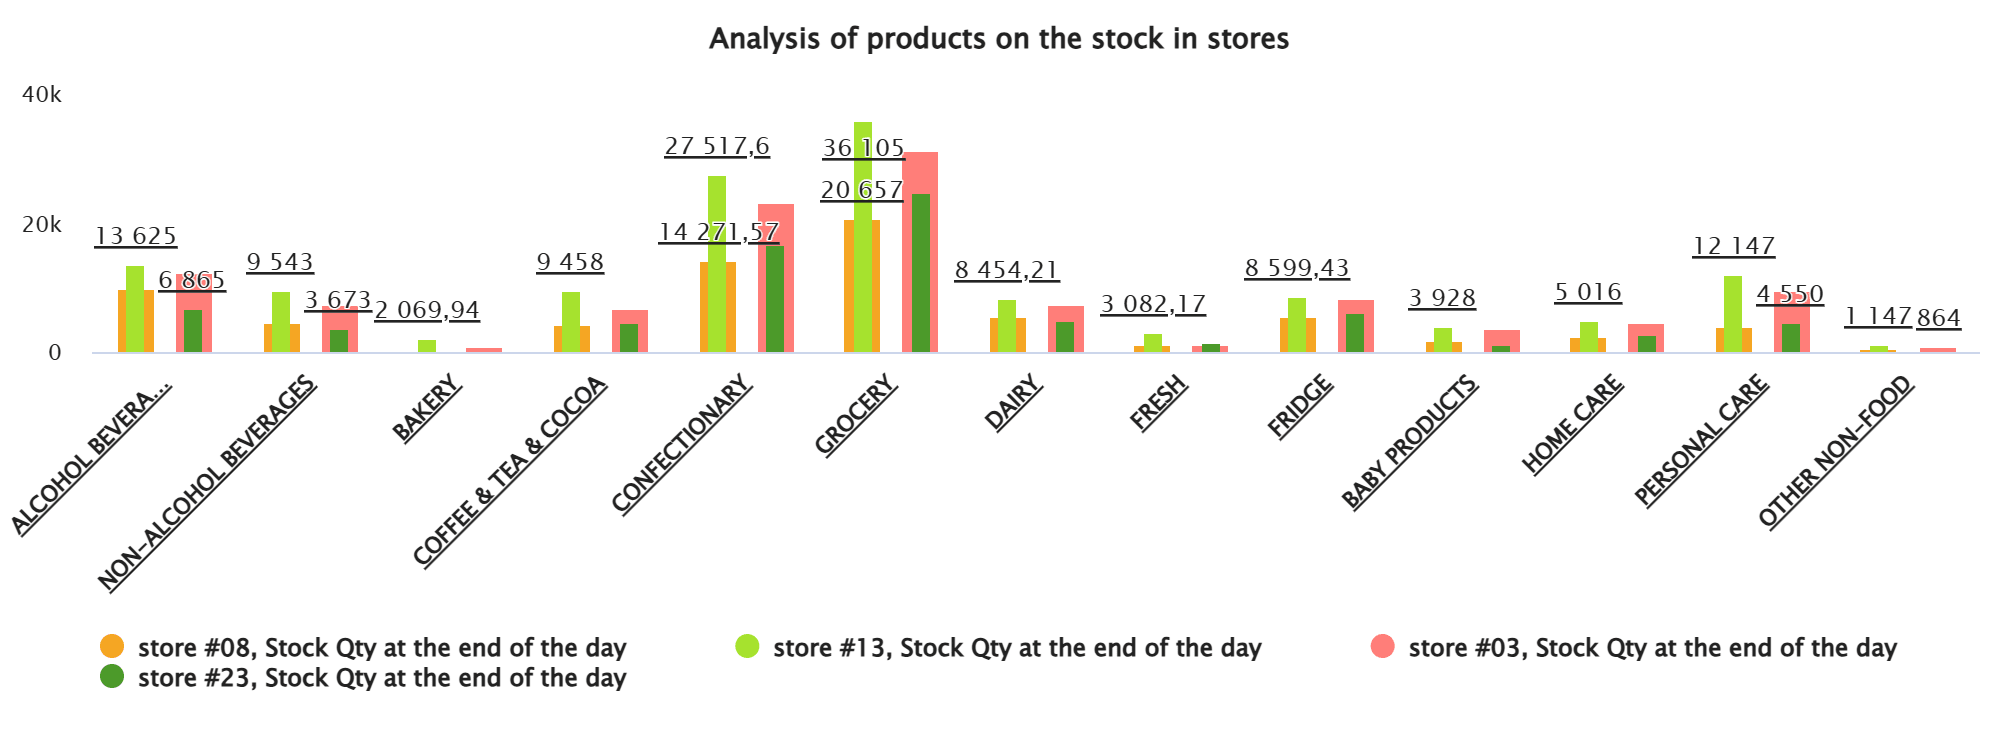
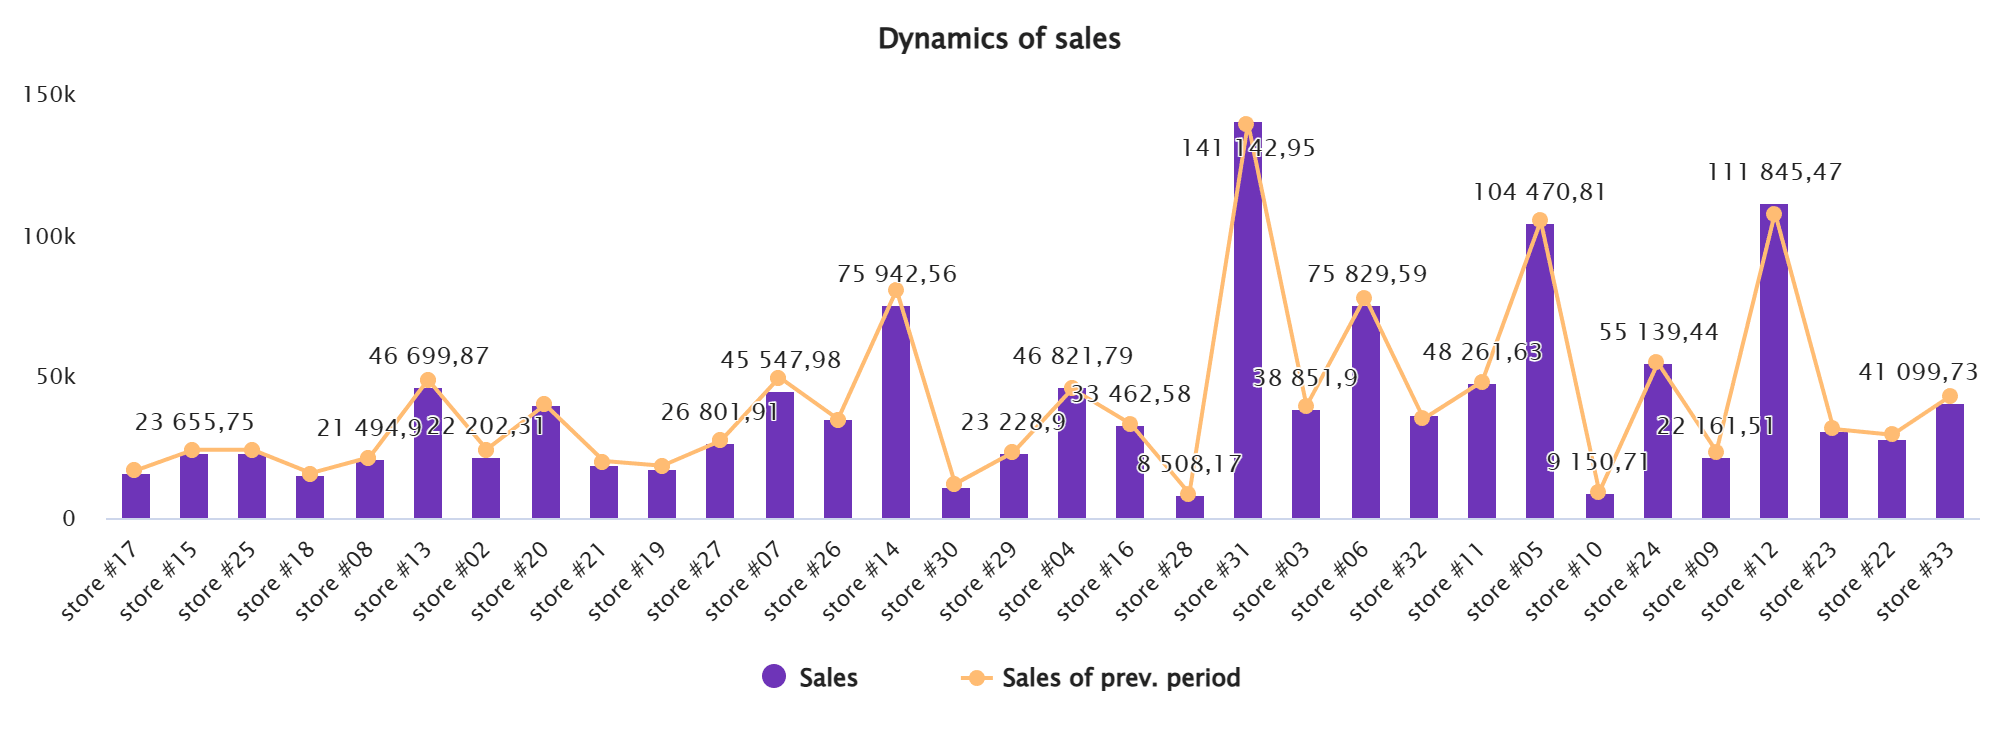
- Bar graph. Bar graphs are handy for comparing multiple categories or items against each other. Such a chart clearly shows where the highest or lowest values are, helping you focus on the differences.
Dashboard Builder
The Builder section of the BES analytics platform contains a wide range of graphical tools for data visualization. Users can create custom-designed dashboards - change colors, shapes, captions - as well as work with 17 chart types and customize key elements such as axes, legends, and scales.


 No credit card required